
Abiotic contribution to total soil CO2 flux across a broad range of land-cover types in a desert region
Cite this Article
MA Jie, LIU Ran, LI Yan. , Abiotic contribution to total soil CO2 flux across a broad range of land-cover types in a desert region . Journal of Arid Land, 2017, 9(1): 13-26. 
Permissions
Copyright©2017, 《干旱区科学》编辑部
《干旱区科学》编辑部 所有
Abiotic contribution to total soil CO2 flux across a broad range of land-cover types in a desert region
Abstract
As an important component of ecosystem carbon (C) budgets, soil carbon dioxide (CO2) flux is determined by a combination of a series of biotic and abiotic processes. Although there is evidence showing that the abiotic component can be important in total soil CO2 flux ( Rtotal), its relative importance has never been systematically assessed. In this study, after comparative measurements of CO2 fluxes on sterilized and natural soils, the Rtotal was partitioned into biotic flux ( Rbiotic) and abiotic flux ( Rabiotic) across a broad range of land-cover types (including eight sampling sites: cotton field, hops field, halophyte garden, alkaline land, reservoir edge, native saline desert, dune crest and interdune lowland) in Gurbantunggut Desert, Xinjiang, China. The relative contribution of Rabiotic to Rtotal, as well as the temperature dependency and predominant factors for Rtotal, Rbiotic and Rabiotic, were analyzed. Results showed that Rabiotic always contributed to Rtotal for all of the eight sampling sites, but the degree or magnitude of contribution varied greatly. Specifically, the ratio of Rabiotic to Rtotal was very low in cotton field and hops field and very high in alkaline land and dune crest. Statistically, the ratio of Rabiotic to Rtotal logarithmically increased with decreasing Rbiotic, suggesting that Rabiotic strongly affected Rtotal when Rbiotic was low. This pattern confirms that soil CO2 flux is predominated by biotic processes in most soils, but abiotic processes can also be dominant when biotic processes are weak. On a diurnal basis, Rabiotic cannot result in net gain or net loss of CO2, but its effect on transient CO2 flux was significant. Temperature dependency of Rtotal varied among the eight sampling sites and was determined by the predominant processes (abiotic or biotic) of CO2 flux. Specifically, Rbiotic was driven by soil temperature while Rabiotic was regulated by the change in soil temperature (Δ T). Namely, declining temperature (Δ T<0) resulted in negative Rabiotic (i.e., CO2 went into soil) while rising temperature (Δ T>0) resulted in positive Rabiotic (i.e., CO2 released from soil). Without recognition of Rabiotic, Rbiotic would be overestimated for the daytime and underestimated for the nighttime. Although Rabiotic may not change the sum or the net value of daily soil CO2 exchange and may not directly constitute a C sink, it can significantly alter the transient apparent soil CO2 flux, either in magnitude or in temperature dependency. Thus, recognizing the fact that abiotic component in Rtotal exists widely in soils has widespread consequences for the understanding of C cycling.
Key words:
soil CO2 flux; biotic flux; abiotic flux; temperature dependence; Gurbantunggut Desert
1 Introduction
As a primary path to release plant-fixed carbon dioxide (CO2) back to the atmosphere (Ryan and Law, 2005), soil CO2 flux, often referred to as ‘ soil respiration’ , releases carbon (C) at a rate that is more than one order of magnitude larger than the anthropogenic emission (Marland et al., 2008). Thus, a small change in soil CO2 flux can have a strong impact on the balance of atmosphere CO2 concentration (Raich et al., 2002). Moreover, soil CO2 flux has been used to characterize the processes and properties of terrestrial ecosystems, such as soil C turnover time (Barrett et al., 2006; Elberling et al., 2006), origins of soil organic matter (Crow et al., 2006) and distributions and activities of belowground biotic communities (e.g., microbes; Shamir and Steinberger, 2007). Thus, a thorough understanding of soil CO2 flux is essential to further comprehending the C cycle in terrestrial ecosystems (Ball et al., 2009).
A number of studies have explored the dominant factors of soil CO2 flux, but large uncertainties remain (Davidson and Janssens, 2006; Carbone et al., 2008; Hardie et al., 2011). At the global scale, soil CO2 flux was confirmed to be significantly correlative with annual mean temperature and mean annual precipitation (Raich and Schlesinger, 1992; Raich et al., 2002). At regional scales, however, no consensus has been reached because the dominant factors may vary greatly from region to region (Davidson et al., 1998; Liu et al., 2006) and even differ within the same ecosystem (Cable et al., 2011). An important reason for such discrepancies or differences is that soil CO2 flux is a combined result of a series of biotic and abiotic processes, each of which exhibits its own flux behavior at various time scales and responds differently to environmental factors (Li et al., 2005; Ryan and Law, 2005). Conventional wisdom is that soil respiration comprises microbial (heterotrophic) and root (autotrophic) respirations. Heterotrophic respiration is regulated mainly by soil temperature and soil moisture while autotrophic respiration may be closely linked to C assimilation and allocation (Li et al., 2005; Tang et al., 2005). However, recent reports on negative CO2flux (i.e., CO2 goes into soil) (Parsons et al., 2004; Stone, 2008; Xie et al., 2009; Shanhun et al., 2012; Ma et al., 2013) contradicted the conventional wisdom in defining soil respiration, that is, soil respiration only constitutes biotic processes (including autotrophic and heterotrophic respirations) and only releases CO2 out of the soil (Baldocchi, 2003; Luo and Zhou, 2006). Abiotic processes, such as carbonate dissolution (Emmerich, 2003; Mielnick et al., 2005; Stevenson and Verburg, 2006), surface adhesion of CO2 on soil particles (Parsons et al., 2004), ventilation of subterranean cavities (Serrano-Ortiz et al., 2010) and changes in CO2 solubility in soil water films (Karberg et al., 2005; Ma et al., 2013), had been proven to contribute to total soil CO2 flux (Rtotal) on short time scales. An extreme but powerful example is that in saline desert (Xie et al., 2009) and Antarctic dry valleys (Parsons et al., 2004; Shanhun et al., 2012), where biotic respiration is inherently low due to weak biotic activities (Cable et al., 2011), the abiotic processes have a pronounced and even dominant contribution to Rtotal (Ma et al., 2013). Such abiotic processes act together with biotic processes in determining the magnitude and sign (positive or negative) of Rtotal. Thus, it is more accurate to name the direct measured soil CO2 flux as apparent Rbiotic (biotic flux) to distinguish it from the true Rbiotic in traditional definition. The apparent flux can be significantly modified by the ‘ hidden’ and neglected abiotic flux, and the extent of this modification may vary among different soils under different land-cover types. To date, however, no experiment has been conducted to quantify the magnitude of the impact ofRabiotic (abiotic flux) on Rtotal over a broad range of land-cover types (Elberling et al., 2014).
In Gurbantunggut Desert, the negative CO2 flux has been regularly observed by long-term monitoring of soil CO2 flux (Xie et al., 2009; Ma et al., 2013). This desert region includes a broad range of land-cover types, such as saline or sandy deserts, farmlands, botanical gardens and reservoirs. Correspondingly, soil properties, microbial activities, and vegetation communities differ dramatically over different land-cover types and these differences are likely to have exerted significant influences on biotic and abiotic fluxes, resulting in the differences of Rtotal.
Here, we present a study aimed at quantifying the contribution of abiotic component to Rtotal over a broad range of land-cover types (including eight sampling sites: cotton field, hops field, halophyte garden, alkaline land, reservoir edge, native saline desert, dune crest and interdune lowland) in Gurbantunggut Desert. The main objectives were as follows: (1) to partition the Rtotal into Rbiotic and Rabiotic and to determine the temperature dependency for diurnal courses of these three fluxes; (2) to quantify the relative contribution of abiotic component to Rtotal; and (3) to identify the predominant factors affecting Rtotal, Rbiotic andRabiotic.
2 Study area and methods
2.1 Study area
The study was conducted in the vicinity of the Fukang National Field Scientific Observation and Research Station for Desert Ecosystems (Chinese Academy of Sciences) and the study area is within a desert-oasis ecotone situated in the southern edge of Gurbantunggut Desert (44° 17′ N, 87° 56′ E; 475 m a.s.l.), Xinjiang, China. The area is characterized by a continental arid temperate climate with dry hot summers and relatively wet and rather cold winters. Annual mean temperature is 5° C-7° C, mean annual precipitation is about 167 mm and mean annual potential evaporation is as high as 2000 mm. Soils in this region are poorly developed, typically with high pH, high salt contents, low moisture availability and low organic matter contents.
Totally eight sampling sites were selected from the desert-oasis ecotone: cotton field, hops field, halophyte garden, reservoir edge, native saline desert, alkaline land, dune crest and interdune lowland. The farthest distance between any of two neighboring sites is less than 22 km. The eight sampling sites are different from one another in terms of vegetation type, plant density, canopy height, irrigation history (for cultivated land) and groundwater table (Table 1). Vegetation in halophyte garden, cotton field and hops field is man-made with different lengths of land-use histories (halophyte garden, 12 years; cotton field, 25 years; and hops field, 55 years); whereas vegetation in the rest five sampling sites is natural. The dominant plant species is Tamarix ramosissima in native saline desert site with a plant density of 145 plants/hm2 and Halostachys caspica in reservoir edge site with a plant density of 275 plants/hm2. It should be noted that in Gurbantunggut Desert, two Haloxylon species are distributed. Both of them are the major dominant species in their respective plant communities. Specifically, Haloxylon ammodendron dominates the interdunes and the flat slopes of dunes while Haloxylon persicum occupies the top of dunes with both species rarely growing together (Xu et al., 2014). Vegetation in reservoir edge site is dominated by Halostachys caspica andKalidium foliatum with canopy coverage of approximately 20%. In addition, ephemeral plants and annual plants distribute in native saline desert, reservoir edge, dune crest and interdune lowland sites generally but vary in species. More details can be found in Fan et al. (2014) and Huang and Li (2014).
| Table 1 Environmental characteristics of the eight sampling sites |
2.2 Experimental design for flux measurements
In order to determine the potential contribution of abiotic component to soil CO2 flux, we conducted comparative measurements of CO2 fluxes on sterilized and natural soils. The former was considered to be the abiotic flux (Rabiotic) and the latter the total soil CO2 flux (Rtotal). The difference of the two was the biotic flux (Rbiotic, i.e., Rbiotic=Rtotal-Rabiotic). Sterilization of soil was intended to eliminate biological activity in soil. Results of previous study (Stevenson and Verburg, 2006) showed that autoclaving method was more suitable compared with chemical agent or radiation, thus autoclaving method was used in this study.
For each sampling site, a total of six undisturbed soil columns (three for sterilization treatment and three for control) were sampled by stainless steel tubes (height of 25 cm, inner diameter of 20 cm and outer diameter of 21 cm) in July 2014. Specific sampling processes were as follow. First, stainless steel tubes were inserted vertically into the soil by a hammer until the upper edge was about 4 cm above the soil surface, which represented the parameter ‘ offset’ in the subsequent CO2 flux measurements. Soils around the stainless steel tubes were then dug out, and stainless steel circular plates (thickness of 3 mm) with the diameter (~20.5 cm) slightly greater than stainless steel tubes were carefully inserted into the soil along the bottom edge of stainless steel tubes. After that, soil columns were lifted out and the bottom plates were carefully sealed with waterproof fabric to prevent any possibility of material exchange (e.g., water or gas).
Sterilization was conducted in a medical autoclave for 24 h at 120° C. The tops of stainless steel tubes were sealed by layers of filter and brown paper to minimize water infiltration into or evaporation out of the soil columns. In this way, soil moisture content was not significantly changed after the autoclaving treatment. The aboveground parts of plants were removed before the stainless steel tubes were sealed (for the sterilized soil), or immediately before the measurement started (for the natural soil). Previous experiences from our group (Xie et al., 2009; Ma et al., 2013) confirmed that 24-h autoclaving is sufficient for complete sterilization of soil samples. After sterilization, the stainless steel tubes were placed in an ultraviolet (UV) radiation sterilizing room to allow soil columns to equilibrate with surrounding conditions. The natural soil samples always remained at ambient field temperature. The stainless steel tubes were then moved out of the sterilizing room and reburied in the field at an equivalent height to the surrounding soils to assimilate to the natural temperature fluctuations. It should be noted that all the stainless steel tubes were reburied in the native saline desert site, the nearest site to the laboratory.
CO2 flux was measured with an Automated Soil CO2 Flux System (LI-8150, Lincoln, Nebraska, USA) equipped with six long-term monitoring chambers (LI-8100-104, Lincoln, Nebraska, USA). We denoted CO2 flux from soil to atmosphere with positive values and from atmosphere to soil with negative values. Fluxes were recorded at 30-min intervals for 2 d for each set of soil samples. Soil sampling and CO2 flux measurements were accomplished site-by-site in a sequence of halophyte garden, native saline desert, cotton field, reservoir edge, hops field, alkaline land, dune crest and interdune lowland. Furthermore, we conducted all measurements on clear days within one month (July 2014) to ensure the comparability between different measurements in terms of the weather conditions (e.g., amplitudes and peak times in temperature fluctuation, air humidity and wind speed).
Soil temperature (Tsoil) was measured at 5 cm depth in a soil profile close to the long-term monitoring chambers using a thermocouple connected to the LI-8150, and the data were recorded when each flux measurement was taken. The difference of Tsoil at 5 cm depth was within 2.5° C (data not shown). Besides, the mean wind speed (1.07 m/s) and mean relative humidity (31.22%) during the experimental period were obtained from the adjacent meteorological station.
2.3 Measurements of soil properties and root dry biomass
At the completion of each group of flux measurements, approximately 200 g of soil was collected from each soil column to a depth of 10 cm. Each sample was divided into two parts: one part was sealed in aluminum specimen boxes to estimate soil moisture content by conventional balance-weighing and oven-drying method and the other part was sealed in a hermetic bag to determine pH, electrical conductivity (EC), and total and organic C contents in the laboratory. All those soil samples used for chemical analyses were air-dried and sieved (< 1 mm) in advance. Soil pH and EC were determined on a 1:5 soil:deionized water suspension, using a Sartorius PP-20 Professional Meter (Sartorius, Germany) and a portable conductivity meter (Hach, USA), respectively. Samples for soil organic C measurements were pretreated with 0.5 M HCl to remove carbonates and then oven-dried (Harris et al., 2001). Soil total and organic C contents were measured by dry combustion using a total organic C/total nitrogen analyzer (multi C/N 3100, Analytik Jena, Germany). The difference between soil total C content and soil organic C content was taken to represent soil inorganic C content. In addition, for each intact soil column (0-20 cm), living roots were sieved out (100-mesh sieve) and weighed to estimate the root dry biomass.
2.4 Data processing
For each set of CO2 flux measurement, data in the first 12 h were discarded because of the disturbance during the reburying, while data in the next 24 h were recorded and used in the following analyses. To quantitatively evaluate the contribution of Rabiotic to Rtotal, we calculated the half-hourly ratios of Rabiotic to Rtotal for the eight sampling sites when Rabiotic was positive (Eq. 1):

For the site-dependent ratio, the half-hourly ratios for each site were grouped and averaged, and mean ratio of Rabiotic to Rtotal was obtained.
The traditional concept on soil CO2 flux assumed that only biotic component contributes to Rtotal. But in this study, the contribution of abiotic component toRtotal was considered and analyzed, and the traditionally defined Rtotal was named as apparent Rbiotic (i.e., the value of biotic flux in traditional definition) to distinguish it from the real Rbiotic. Cumulative CO2 exchanges of Rtotal (apparent Rbiotic) andRbiotic (real Rbiotic) were calculated by numerical integration of Rtotal and Rbiotic for the periods when Rabiotic> 0 (or Rabiotic< 0) respectively as follows (Eq. 2):

Where, Fx is the cumulative CO2 exchange of Rtotal orRbiotic during the periods when Rabiotic> 0 (or Rabiotic< 0) (mg CO2/(m2• d)); Rx means Rtotal orRbiotic (μ mol/(m2• s)); M is the molecular mass of CO2 (44 g/mol); t is the time interval between every two consecutive flux measurements (1800 s).
We used one-way analysis of variance (ANOVA) to test the differences in mean soil properties among the eight sampling sites. Difference was considered significant at the P< 0.05 level. Temperature dependency of Rtotal and its biotic and abiotic fluxes were determined by regressing (stepwise multiple regressions) half-hourly measurements of Rtotal, Rbiotic andRabiotic against concurrent Tsoil and Δ T (change in soil temperature). We performed multiple regressions using the data collected from each single soil sample to identify the predominant factors affecting Rtotal, Rbiotic andRabiotic. All data analyses were performed with SPSS 16.0 and Origin 8.0 softwares.
3 Results
3.1 Soil properties and root biomass
Soil properties significantly varied among the eight sampling sites (Table 2). The eight sites differed both in soil organic C content (F=102.5, P< 0.001; the maximum of 15.85 (± 0.38) g/kg and the minimum of 0.57 (± 0.07) g/kg) and soil inorganic C content (F=92.54, P< 0.001; the maximum of 9.25 (± 0.18) g/kg and the minimum of 1.24 (± 0.05) g/kg). Although the average soil organic C content (5.98 g/kg) was comparable with the average soil inorganic C content (5.08 g/kg), there was no significant correlation between soil organic and inorganic C contents (P=0.83). For example, soil organic C contents were significantly higher than soil inorganic C contents in cotton field, halophyte garden, hops field and interdune lowland, and were considerably lower than soil inorganic C contents in dune crest, reservoir edge, alkaline land and native saline desert.
Soil pH was high for all sampling sites (ranging from 8.00 (± 0.10) to 9.20 (± 0.06)), indicating that the sampling soils were all alkaline. Soil EC ranged from 0.09 (± 0.01) to 14.23 (± 0.87) dS/m, with an average of 3.20 dS/m. Gravimetric soil moisture content was highest in cotton field and lowest in alkaline land (F=79.24, P< 0.001), with the coefficient of variation of 89.36%. In addition, the living root dry biomass was generally low for all sampling sites (average of 18.78 g/m2) and significantly differed among those sites (ranging from 0.95 (± 0.24) to 47.75 (± 4.46) g/m2). In general, the eight sampling sites showed significant differences in soil properties and living root dry biomass along with a wide range of soil organic and inorganic C contents, which provided a natural gradient to differentiate the contributions of Rbiotic and Rabiotic to Rtotal.
| Table 2 Soil properties (0-10 cm) and living root dry biomass (0-20 cm) in the eight sampling sites |
3.2 Partitioning Rtotal into Rbiotic and Rabiotic
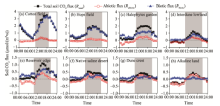
Rtotal exhibited similar diurnal patterns in the eight sampling sites, with positive values appearing in the daytime and single peaks occurring during 13:00-16:00 (Fig. 1). However, those sites significantly differed in CO2 flux rates, with the maximum Rtotal varying from 0.42 μ mol/(m2• s) (dune crest) to 3.72 μ mol/(m2• s) (cotton field). Rtotal was negative during the nighttime in native saline desert, dune crest and alkaline land, in which the Rbiotic was relatively low with the range of 0.001-0.364 μ mol/(m2• s) (Figs. 1f-h). There were significant differences in Rbiotic among the eight sampling sites, either in flux rates or in diurnal patterns. The maximum Rbiotic had the following descending order: cotton field, halophyte garden, hops field, interdune lowland, reservoir edge, native saline desert, dune crest and alkaline land, with the average rate being 0.58 μ mol/(m2• s). Rtotal was significantly correlated with Rbiotic in all sampling sites (Pearson’ s correlation coefficient r ranging from 0.939 to 0.996, P< 0.001) and with Rabiotic in native saline desert, dune crest and alkaline land (r ranging from 0.949 to 0.993, P< 0.001), implying that the dominant processes (i.e., abiotic or biotic) of Rtotalwere different among the eight sampling sites. For Rabiotic, the diel variations were alternations of positive and negative CO2 fluxes over a day for all sampling sites, with the half-hourly flux rates ranging from -0.67 to 0.54 μ mol/(m2• s). Besides, the daily sum of Rabiotic approximated zero (Fig. 1).
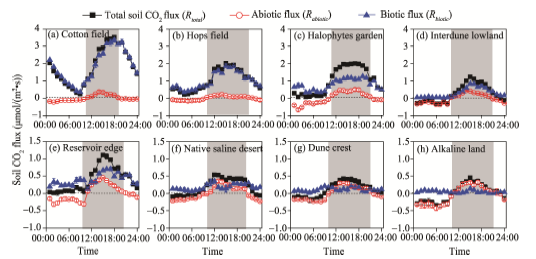 | Fig. 1 Partitioning the total soil CO2 flux (Rtotal) into biotic flux (Rbiotic) and abiotic flux (Rabiotic) in the eight sampling sites. (a)-(h) represent the sites of cotton field, hops field, halophyte garden, interdune lowland, reservoir edge, native saline desert, dune crest and alkaline land, respectively. The shaded parts (grey areas) indicate the periods when Rabiotic> 0. The flux data are the diel averages of three replications with 30-min measurement intervals. The dashed lines indicate that soil CO2 flux equals to zero. |
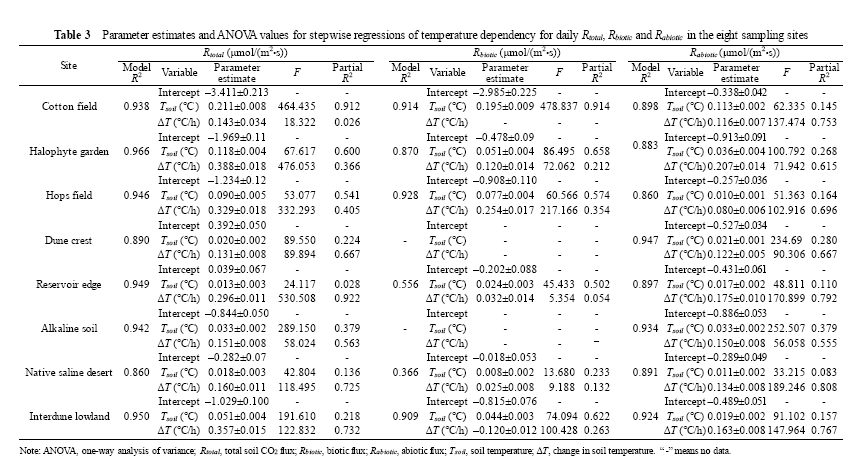
| Table 3 |
3.3 Temperature dependency for diurnal courses ofRtotal, Rbiotic and Rabiotic
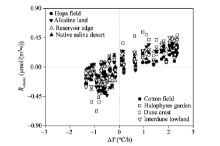
DailyRtotal was linearly correlated with both soil temperature (Tsoil) and the change in soil temperature (Δ T) in all sampling sites, but with intriguing differences in explanatory degree of variations in daily Rtotal among them (Table 3). In cotton field, halophyte garden and hops field, where the Rbiotic dominated the Rtotal (Fig. 1), Tsoil accounted for more than 60% of daily Rtotal variations (partial R2 ranging from 0.541 to 0.912; Table 3). By contrast, in the other five sampling sites, Δ T explained more variations of dailyRtotal than Tsoil did (partial R2 ranging from 0.563 to 0.922). Based on the results of partitioning Rtotal into Rbiotic and Rabiotic (Fig. 1), we separately analyzed the temperature dependency of dailyRbiotic and Rabiotic (Table 3). For dailyRbiotic, Tsoil accounted for most variations of daily Rbiotic in all sampling sites with exception of alkaline land and dune crest sites (Table 3), where Rbiotic was extremely low with irregular variations (Fig. 1). For dailyRabiotic, Δ T explained more variations of dailyRabiotic than Tsoil did in all sampling sites, approximately accounting for 71% (Table 3). It should be stressed that Rabiotic generally exhibited negative values as soil temperature decreases (i.e., Δ T< 0) and positive values as soil temperature increases (i.e., Δ T> 0) (Fig. 2).
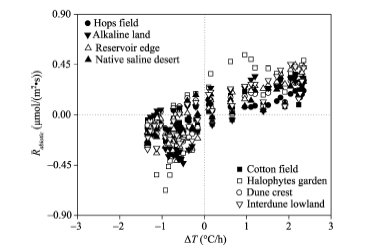 | Fig. 2 Temperature dependency for daily abiotic flux (Rabiotic). Δ T: the change in soil temperature. |
3.4 Relative contribution of Rabiotic to Rtotal
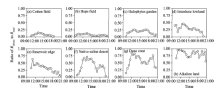
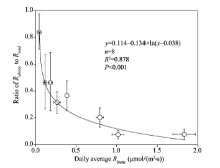
To evaluate the contribution of Rabiotic to Rtotal, we calculated the transient ratios of RabiotictoRtotal for the eight sampling sites during the periods when Rabiotic> 0 (Fig. 3). The transient ratios ranged from 0.007 (cotton field) to 0.995 (alkaline land) with an average of 0.350. When the ratios for each site were grouped, the average ratio ofRabiotic to Rtotal followed a logarithmically decreasing trend as the daily average Rbiotic rising (Fig. 4).
 | Fig. 3 Ratio of Rabiotic to Rtotal during the periods when Rabiotic> 0 for the eight sampling sites |
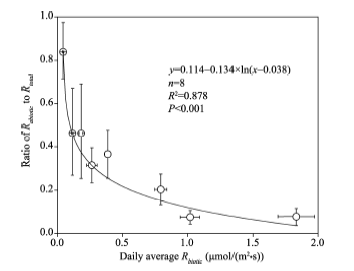 | Fig. 4 Relationship between average ratio of Rabiotic to Rtotal with daily average Rbiotic for the eight sampling sites. Error bars represent standard errors of the mean. |
To further clarify the effect of Rabiotic on Rtotal, we compared the cumulative CO2 exchange between apparent Rbiotic (i.e., Rtotal) and real Rbiotic (i.e., Rbiotic) during the periods when Rabiotic> 0 and when Rabiotic< 0 (Fig. 5), respectively. If the abiotic contribution was ignored and only the biotic contribution was considered, the apparent Rbiotic would be overestimated during the periods when Rabiotic> 0 (apparent Rbiotic> real Rbiotic; Fig. 5a). The overestimation ratio was within the range of 1.07-7.72 with an average of approximately 2.00. Conversely, the apparent Rbiotic would be seriously underestimated during the periods when Rabiotic< 0 (apparent Rbiotic< real Rbiotic; Fig. 5b), and negative cumulative CO2 exchange values appeared in some sampling sites (including dune crest, native saline desert, alkaline land and inderdune lowland), where the values of real Rbiotic were all positive. Specifically, during the periods when Rabiotic< 0, the real cumulative CO2 exchange values through biotic component were 203.17, 287.61, 89.38 and 63.72 mg CO2/(m2• d) in dune crest, native saline desert, alkaline land and interdune lowland, respectively; whereas, the corresponding apparent Rbiotic, which was offset by negative Rabiotic, all became negative with the cumulative CO2 exchange values of -118.00, -29.82, -445.42 and -329.45 mg CO2/(m2• d), respectively. It should be emphasized that we denoted CO2 flux from soil to atmosphere with positive values and from atmosphere to soil with negative values. Thus, the neglecting abiotic component may result in a wrong sign showing the transport direction of soil CO2 flux (Fig. 5).
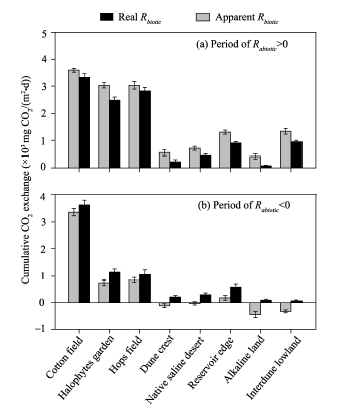 | Fig. 5 Comparison of cumulative CO2 exchange between apparent Rbiotic (i.e., Rtotal) and real Rbiotic (i.e., Rbiotic) during the periods when Rabiotic> 0 (a) and when Rabiotic< 0 (b). Error bars represent standard errors of the mean. |
3.5 Predominant factors affecting Rtotal, Rbiotic and Rabiotic
The predominant factors affecting Rtotal and its biotic and abiotic fluxes were analyzed by multiple regressions (Table 4). Living root dry biomass was significantly correlated with Rbiotic and explained 91% of Rbiotic variations across the eight sampling sites (i.e., in terms of the means of all eight sites). For Rabiotic, although soil moisture content explained less of the variations in Rabiotic than soil pH did, both of them were significantly correlated with Rabiotic (P< 0.05), indicating that Rabiotic was determined by those two factors. Because the sum of Rabiotic was about zero over a diel cycle (Fig. 1), the daily cumulative CO2 exchange from Rtotal generally equaled to that from Rbiotic. As a result, the variations in Rtotal were also significantly correlated with living root dry biomass (model R2=0.91, P< 0.001).
| Table 4 Predominant factors affecting Rtotal, Rbiotic and Rabiotic across the eight sampling sites |
4 Discussion
The variations in total soil CO2 flux (Rtotal) and its biotic and abiotic fluxes over the eight sampling sites demonstrated that Rtotal is predominated by the biotic processes in most soils (Hanson et al., 2000), but the abiotic processes can be dominant when the biotic processes are weak. Being consistent with previous reports (e.g., Ball et al., 2009; Shanhun et al., 2012; Ma et al., 2013), our study further confirmed that temperature was the most important factor influencing the diel cycle of Rtotal. Soil temperature (Tsoil), together with the change in soil temperature (Δ T), explained more than 90% of daily Rtotal variations at all sampling sites (Table 3), while differences among sites can be best explained by the variations of predominant processes (biotic or abiotic). Specifically, when Rtotal was not significantly different from Rbiotic, as observed in cotton field and hops field, Tsoil explained more variations of daily Rtotal than Δ T did. By contrast, when Rtotal was not significantly different fromRabiotic, as observed in alkaline land and dune crest, Δ T explained more variations of daily Rtotal than Tsoil did. The results revealed the differences in temperature dependencies of Rbiotic and Rabiotic. That is, Tsoil controlled Rbiotic while Δ T dominated Rabiotic (Ball et al., 2009). Thus, temperature dependency of Rtotal was a combined effect of both biotic and abiotic processes.
Rabiotic, regulated by Δ T, was also observed in Antarctic soils, which are also characterized by high soil pH values, high salt contents and low organic C contents as desert soils exhibit (Parsons et al., 2004; Ball et al., 2009; Shanhun et al., 2012). As shown in Figure 2, Rabiotic generally exhibited negative values as soil temperature decreases (i.e., Δ T< 0) and positive values as soil temperature increases (i.e., Δ T> 0). Abiotic controls over the dissolution chemistry of CO2 in the soil solution, as outlined by Henry’ s Law, was suggested to be responsible for the daily variations of Rabiotic (Plummer and Busenberg, 1982; Karberg et al., 2005; Ball et al., 2009; Shanhun et al., 2012). The decreased temperature allowed CO2 to be dissolved in the soil solution, while the increased temperature induced CO2 to be less soluble and caused the exsolution of CO2 from the soil solution. This explanation is attractively testable because solubility is easy to estimate based on Henry’ s Law and other well-established methods (Ma et al., 2013; Roland et al., 2013). The results of our previous study (Ma et al., 2013), based on experimental and modeling analyses, have proven that both the dissolution and exsolution of CO2 into and out of the soil solution can account for the variations of Rabiotic. Besides, as outlined by Stevenson and Verburg (2006) and Hamerlynck et al. (2013), the presence of carbonates can also induce CO2 absorption or emission by affecting the concentrations of dissolved inorganic carbon (DIC) and total alkalinity. However, in this study, the CO2 exchanges between soil air and soil solution is advocated to be a major contributor to daily variations of Rabiotic rather than precipitation/dissolution of the carbonates. As shown in Table 4, the magnitude of Rabiotic mainly depended on soil pH and soil moisture content. More than 60% of variations in Rabiotic can be explained by soil pH, as pH is a major determinant of CO2 solubility in the soil solution (Ma et al., 2013). A similar result was found in alkaline desert soils (Xie et al., 2009), where CO2 uptake was significantly correlated with soil pH. Another line of evidence came from the study of Karberg et al. (2005). That study showed that increasing soil pH caused an increase in total dissolved CO2. Soil moisture content also had a great impact on the magnitude of Rabiotic. Increasing soil moisture content would lead to greater variations in the magnitude ofRabiotic by providing a larger source or sink of DIC involved in the exchange (Ball et al., 2009; Shanhun et al., 2012).
On the daily cycle, the CO2 dissolved in the soil solution during the nighttime was exsolved from the soil solution during the daytime, resulting in a diel pattern of alternating negative and positive CO2 fluxes with a daily sum of zero (Fig. 2). One may argue that such a CO2 dissolution or exsolution process could not be considered as a true CO2 source or sink over a longer period of time, but its influence on transient CO2 flux was significant (Fig. 5). Our argument here is that the apparent Rbiotic (i.e., Rtotal) was clearly underestimated compared to the real Rbiotic during the periods when Rabiotic> 0 (Fig. 5a), whereas the apparent Rbiotic was significantly underestimated during the periods when Rabiotic< 0. Namely, without recognition of Rabiotic, the apparent Rbiotic would be overestimated for the daytime and underestimated for the nighttime. Similar conclusions were reached by noting the variations in apparent respiratory quotient (defined as the ratio between CO2 efflux and oxygen influx) for three calcareous soil sites (Angert et al., 2015). Additionally, the dissolved CO2 in the soil solution could be leached away from the soil by surface runoff, within-soil drainage or groundwater-table fluctuations (Kindler et a., 2011; Ma et al., 2014; Li et al., 2015), which would then affect the total net ecosystem C exchanges (Kindler et al., 2011) and should be included in the long-term CO2 budget (Serrano-Oritz et al., 2010).
An abiotic effect on Rtotal is not negligible especially in alkaline soils, but the magnitude varied greatly across different land-cover types (Figs. 1 and 4). The relative contribution of Rabioticto Rtotal (i.e., Rabiotic/Rtotal) is the key to discerning whether Rabiotic is important or not (Ma et al., 2013). In the soils with preferable substrates and considerable amount of living roots (Table 2), the biotic component produces by far larger CO2flux than the abiotic component and it is thus unnecessary to consider the abiotic contribution. That is the reason why Rabiotic was masked/neglected in most ecosystems (Parsons et al., 2004). However, in some extreme conditions, such as alkaline land or dune crest, the Rabiotic is of sufficient strength to be comparable to or even larger than the Rbiotic, resulting in an obvious underestimation or overestimation of apparent Rbiotic (Figs. 1 and 5). In such cases, the effect of Rabiotic should not be overlooked. The ratio of Rabiotic toRtotal logarithmically decreased with increasing Rbiotic (Fig. 4), suggesting that there was a strong effect of Rabiotic on Rtotal when Rbiotic was low (Fig. 3). Similar results were also reported in Anarctic desert-like soils (Shanhun et al., 2012) and saline/alkaline soils (Ma et al., 2013), in which Rabiotic had no significant difference with Rtotal.
The aforementioned information showed that Rtotal, previously thought to be of purely biological origin, is actually a mixed flux, a result of Rbiotic being offset or intensified by Rabiotic. From this point of view, the misestimates (underestimation or overestimation) of Rbiotic have profound implications for quantifying the turnover time of soil C pool, because the misestimated values have been used to calculate the mean residence or turnover time of soil C pool with the assumption that the contribution of living root respiration was a known proportion of total soil respiration (Raich and Schlesinger, 1992; Elberling et al., 2006). Additionally, it would be inappropriate to use the soil CO2 flux in running empirical models without considering abiotic factors. An example of such misuse is extrapolating the respiration on time scales or spatial scales based on relationships between environmental factors and CO2 flux (Fang and Moncrieff, 2001; Yuste et al., 2003; Vargas and Allen, 2008) derived from discontinuous measurements or even point observations without considering Rabiotic (Bolstad et al., 2004; Lee et al., 2010).
5 Conclusions
When biotic processes are strong, the abiotic processes may have a negligible influence on soil CO2 flux. However, if biotic processes are weak, the abiotic processes may dominate soil CO2 flux. Generally speaking, Rbiotic (biotic flux) can be overestimated for the daytime and underestimated for the nighttime if abiotic contribution is ignored. Although Rabiotic may not change the sum or the net value of daily soil CO2 exchange and may not directly constitute a C sink, it can significantly alter transient apparent soil CO2 flux, either in magnitude or in temperature dependency. Thus, the recognition that the abiotic component in the soil CO2 flux is ubiquitous in alkaline soils has widespread consequences for the study of C cycling.
The study was supported by the National Natural Science Foundation of China (41301279, 41201041), the International Science & Technology Cooperation Program of China (2010DFA92720) and the Knowledge Innovation Project of the Chinese Academy of Sciences (KZCX2-YW-T09). The authors thank WANG Bin, LI Yuanli, LIU Hao and other staff of the Fukang National Field Scientific Observation and Research Station for Desert Ecosystems for their assistance.
The authors have declared that no competing interests exist.
Reference
| 1 |
|
| 2 |
|
| 3 |
|
| 4 |
|
| 5 |
|
| 6 |
|
| 7 |
|
| 8 |
|
| 9 |
|
| 10 |
|
| 11 |
|
| 12 |
|
| 13 |
|
| 14 |
|
| 15 |
|
| 16 |
|
| 17 |
|
| 18 |
|
| 19 |
|
| 20 |
|
| 21 |
|
| 22 |
|
| 23 |
|
| 24 |
|
| 25 |
|
| 26 |
|
| 27 |
|
| 28 |
|
| 29 |
|
| 30 |
|
| 31 |
|
| 32 |
|
| 33 |
|
| 34 |
|
| 35 |
|
| 36 |
|
| 37 |
|
| 38 |
|
| 39 |
|
| 40 |
|
| 41 |
|
| 42 |
|
| 43 |
|
| 44 |
|
| 45 |
|
| 46 |
|
| 47 |
|