


A method to estimate aquifer artificial recharge from a hill dam in Tunisia
[Zouheira IBN ALI1, *  , Ibtissem TRIKI
1 , Lamia LAJILI-GHEZAL2 , Moncef ZAIRI1 ]
, Ibtissem TRIKI|
|


In arid and semi-arid areas, artificial recharge is a key technology in groundwater resources management, and a reliable estimate of artificial recharge is necessaryto its sustainable development. Several methods are available to estimate the artificial recharge; however, most of them require field data or model parameters, thus limitingtheir applications. To overcome this limitation, we presented an analytical method to estimate the artificial recharge through monitoring the water release by piezometer and analysing the controlling factors of the artificial recharge from a hill dam in Tunisia. A total of 97 measurements of water flow in the streambed recorded from4 gauging stations were analysed. Results indicated that the average infiltration velocity ranged from 0.043 to 0.127m/d and the infiltration index varied from 7.6 to 11.8 L/(s•km). Pearson’s correlation coefficient analysis shows that the infiltration index, the stream gradient, the thickness of unsaturated zone, the number of infiltration pond, the stream geometry, and the water flow rate were found to be the main factors in determining the infiltration. The high correlation coefficients (0.908for the number of infiltration pondand 0.999 for the stream geometry) mean that the number of infiltration pondand the stream geometry are the most influential factors. Time variations of groundwater level were used to analyze the recharge effects on the piezometry of aquifer. The analysis showed that during the artificial recharge, the water table increased at a rate of5 mm/d and that the increase was limited to the area surrounding the recharge site. Based on the results of the study, building infiltration ponds along streambed and improving the potential of rainwater harvesting over the study area are recommended.
Tunisia, situated in the southwestern Mediterranean, is known by its semi-arid climate where water shortage and over-exploitation of groundwater caused a continuous decrease of groundwater level (General Water Resources Direction (DGRE), 1995; Triki et al., 2014). Therefore, various measures were taken by Tunisian government to overcome such a shortage through the implementation of the ‘ ‘ National Strategy of Surface Runoff Mobilization’ ’ . Artificial groundwater recharge from hill dams is one of such measures widely used to improve groundwater recharge(BelHadj Salem et al., 2012). However, quantitative estimate of the artificial groundwater recharge is a challenging problem. Several methods have been developed to estimate the artificial groundwater recharge in arid environments (Allison et al., 1994; Goodrich et al., 2004; Kalbus et al., 2006; Shanafield and Cook, 2014). And, those methods can be classified into two groups: (1) potential recharge estimatesand (2) actual groundwater recharge estimates. The first group includes those techniques that are based on the measurements of surface streambed point data and unsaturated-zone data. The volume of groundwater recharge can be obtained either by computing the river reach water balance or by measuring the difference between upstream and downstream water flows (Zammouri and Feki, 2005; Harte and Kiah, 2009).The first groupis either based on the velocity changes along the longitudinal direction of flow (Lange, 2005) or on the infiltration under the stream (Kumar et al., 2009). The recharge estimates using the first group of the methods were normally achieved either thoughgeophysicalmethods (Alaoui and Eugster, 2004; Dahan et al., 2008; Blasch et al., 2010) orgeochemical tracers (Harvey et al., 1996; Greene, 1997; Hoehn, 1998; Fellows et al., 2001). It should be noted that many different geochemical tracershave been employed (Fulton, 2012) and the used tracersinclude radon (Cook, 2013), tritium (Carlson et al., 2011), helium (Carlson et al., 2011), stable isotopes of hydrogen and oxygen (Dogramaciet al., 2015) and carbon isotope (Fulton, 2012). The second group (i.e., actual groundwater recharge estimates) includes those techniques that are based on measurements within the groundwater under the stream. The computation is achieved by several equations (Besbes et al., 1978; Sorman et al., 1993; Zammouri and Feki, 2005).
In addition, numerical modelling methods have also been used for estimating artificial recharge. Unsaturated flow simulating models include bucket model (Flint et al., 2002; Walker et al., 2002), multi-dimensional drainage model (Oude Essink, 1998; Yeh et al., 2010) and numerical solutions to the Richards equation (Š imů nek et al., 2005; Shiraki et al., 2006). And, saturated flow simulating models include MODFLOW used for 2D or 3D saturated flow (McDonald and Harbaugh, 1988; Scibek and Allen, 2006). Recently, surface and groundwater models were integrated to provide a framework for monitoring the surface-groundwater coupled water system (Koch et al., 2011; Huntington and Niswonger, 2012). However, most of them require in-situ measurements of water flows or the needed model parameters, thus limiting their applications. Finally, it should be also mentioned that the factors influencing groundwater recharge have been extensively studied and those factors include depth to groundwater, hydraulic properties, geologic heterogeneity, soil properties, land covers and climate (Sophocleous, 2002; Keese et al., 2005; Andreo et al., 2008; Kumar et al., 2009; Chartier et al., 2011; Candela et al., 2012; Jimé nez-Martí nez et al., 2013; Park et al., 2014).However, the studies on the factors controlling local groundwater recharge in topographic depressions are rare and the quantitative estimates of the artificial groundwater rechargein topographic depressionsare even rarer in the existing literature. This paper aims to develop a direct analytical method of infiltration measurements and to identify the controlling factors on the recharge.
Nadhour-Saouaf syncline (Zaghouan District, northern Tunisia) covers more than 400 km2 between mountain ranges to the northwestern edge and alluvial plain to the south (Fig. 1). The elevation varies from 78 to 923 m a.s.l. The climate of the study area is mostly semi-arid, with hot dry summers andcool wet winters. The mean annual precipitation is about 400 mm, while the potential evapotranspiration isas high as 1560 mm. The annual mean temperature is 18° C. The complex hydrogeological setting and high relief favour the development of a dense hydrographic network. Hence, several ephemeral watercourses (also called wadis) characterized by fluvial deposits consisting of highly permeable coarse sediments run across the basin. The infiltration of the flood water through beds of ephemeral streams is the major source of natural aquifer recharge. The hydrogeological data, rainfall, groundwater levels, groundwater abstraction, and artificial recharge data were also collected for this study.
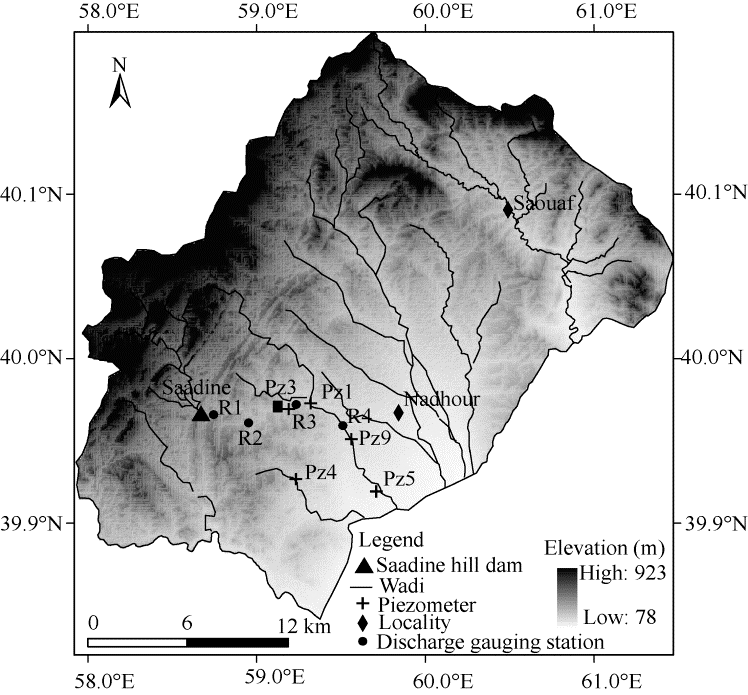 | Fig. 1 Topographical map of the Nadhour-Saouaf watershed |
2.1.1Hydrogeological setting
Quaternary deposits largely outcrop to the south of Zaghouan area and Plio-Quaternary formed the fillings of the syncline whereas Miocene showed a thick sequence of lignite to the north and medium to coarse sandstone to the south. The upper Oligocene unit, situated in the borderingedges of infiltration, is mainly composed of coarse sandstone and clay. The Lower Eocene deposits are composed of limestone beds. Upper Eocene deposits, a thick sequence of clay and marl, constitute the superficial aquifer substrate, outcropping near the borders of the studied syncline. The topographic heights of Mesozoic formations dominate the north of the studied area (Figs. 2a and b). The Nathour-Saouaf aquifer represents an important reservoir due to its extension and thickness. The transmissivity ranged between 0.012and 0.036 m2/s with a hydraulic conductivity of 30× 10-6to 8.7× 10⁻³m/s (SCET, 2002). In the Nathour-Saouafwatershed, the aquifer has been pumped since 1980s. In 2000, the total extraction volume reached the maximum of5.2× 106m3.Thus, since 1982, the groundwater level has continuously declined with a maximum-amplitude of 4.5 m during the period of 1995-1996.
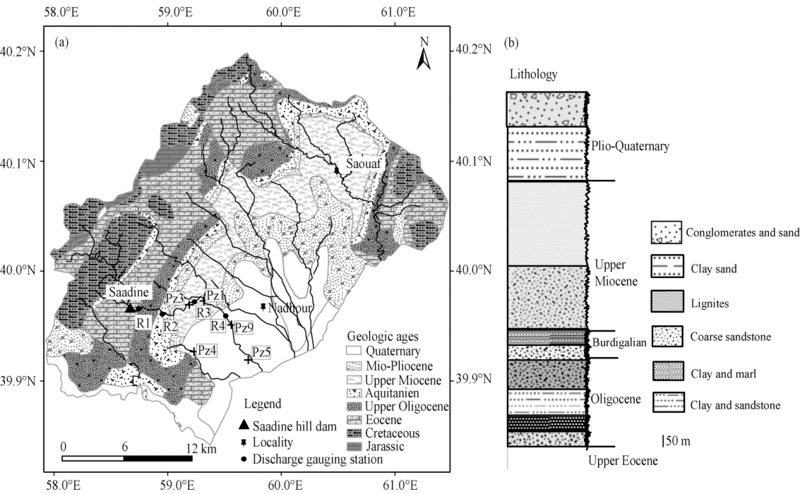 | Fig. 2 Geological map (a) and synthetic litho-stratigraphic column of the study area (b) |
2.1.2Monitoring of artificial recharge
During the period from 1Marchto 15August 2006, an operation of artificial groundwater recharge was conducted in Nadhour-SaouafBasin by releasing water from the Saadine hill dam. An area of 115× 103m2 in the Saadine riverbed was submersed. The water flow was controlled at four gauging stations (i.e., R1, R2, R3, and R4). Therefore, the streambed was divided into three reaches (R1-R2, R2-R3, and R3-R4) with lengths of 3.0, 3.7, and 4.8 km, respectively. The schematic representation of Figure3 illustrates the spatial positions of the runoff gauging stations and the reaches. A total of 97 streamflow measurements were doneand the measured flow rate ranged from 171 to 9000 m3/d during the experiment. The groundwater level resulted from artificial recharge was analyzed using the data of monthly groundwater level monitoring with the piezometers installed near the gauging stations.
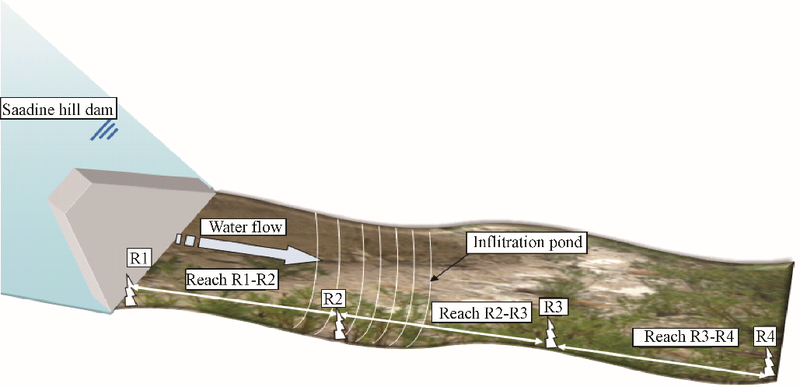 | Fig. 3 Schematic representation of the stream reaches |
The direct analytical method used the water budget model to estimate stream infiltration. The equation of the water budget model is as follows:
I=Qin-Qout-ET. (1)
Where Iis the stream infiltration (L3/t), Qin is the upper flow (L3/t), Qout is the lower flow (L3/t), and ET is the evapotranspiration (L3/t).
Multiplying each term of Equation 1 by the time period of recharge, we obtained the corresponding volume (L3) of water budget according to the Equation 2:
Vinf=Vin-Vout-Ve. (2)
Where Vinf is the total infiltrated water volume, Vin is the upper entering volume, Vout is the lower exiting volume, and Ve is total evaporation volume. The evaporation volume was calculated using the daily evaporation data measured at the nearest meteorological station (National Institute of Meteorology (NIM), 2006).
Then, the infiltration velocity Iv(L/t) was calculated using Equation 3:
Iv=Vinf/day/S. (3)
Where S is the reach area (L2).
The procedure of differential flow gauging was used to determine surface water and groundwater exchanges (Harte and Kiah, 2009; McCallum et al., 2012). Artificial recharge consisted of releasing water from the hill dam in the streambed. The available data for potential groundwater artificial recharge included the observed streamflow data and evaporation data during the 167monitoring days (i.e., 1Marchto 15August 2006). The rate of the water flow from hill dam to streambed was controlled. The stream flow was gauged at successive downstream runoff stations using the velocity-area method. During all recharge laps, the flow can be considered stable. Thus, the analytical method can be applied to determine the distribution of the stream infiltration and then to differentiate the characteristics of different stream reaches. The infiltration index, unsaturated zone thickness, infiltration pond, stream slope, stream geometry, and water flow rate were considered as the most important factors controlling the recharge.
Water table fluctuation method (WTF) was commonly used for estimating groundwater recharge (Healy and Cook, 2002; Kung et al., 2013). This method assumes that the water-level rise in an unconfined aquifer is caused by recharge arriving at the water table and that the specific yield is constant.
Recharge R(L/t) was therefore calculated using the Equation 4:
$R={{S}_{y}}\frac{dh}{dt}={{S}_{y}}\frac{\Delta h}{\Delta t}.$(4)
Where Sy is the specific yield, his the water-table elevation, and dh/dt is the derivative of water-table height to time approximated as the difference in h over the elapsed time Δ t between the measurements of h. The rise in the water-table was computed as the difference between the peak of the rise at time t and the level to which water level would have declined if the recharge has not occurred.
In this study, the available data for groundwater artificial recharge estimation includes observed groundwater level fluctuations and estimates of aquifer specific yield. The groundwater level was monthly monitored using electric probe. The effect of water release was monitored using a piezometer installed near the streambed. The average aquifer specific yield was obtained from aquifer pumping tests usingNeuman (1975) method.
The streambed infiltration was influenced by climate variability and other factors including soil type, slope, stream geometry, and frequency and location of stream crossings (Sophocleous, 2002; Park et al., 2014). Subsurface geology is also an important factor affecting the infiltration process. The infiltration index was used to study water infiltrating volume per unit time through a unit stream reach length. The infiltration index is expressed as L/(s• km). Thus, infiltration index can be mathematically calculated by dividing the total infiltrated volume by the time of recharge operation within a stream length unit.
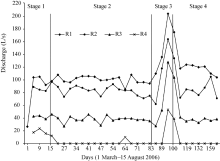
According to the released amounts of water, the discharge hydrograph can be divided into four stages (Table 1; Fig. 4). The first stage was completed with a flow rate of82 L/s during the first 15 days. Average infiltration velocities in the three reaches were 0.050, 0.127, and 0.046m/d, respectively. The second stage of water release was completed on the 83rd day and lasted for 68 days. The flow rate was set up at values of 85 to 110L/s so that the water did not flow over R3-R4reach. The third stage of water release was completed on the 100th day and lasted for 17 days. To attain the optimal infiltration capacity, the flow rate was rapidly increased and reached the highest value of 204L/s. The average infiltration velocities were 0.114, 0.084, and 0.090 m/d in the reaches R1-R2, R2-R3, and R3-R4, respectively. The fourth stage lasted for 66 days. To achieve the best infiltration velocity, the flow rate was maintained at a high level (at 124L/s). The average infiltration velocities in the reaches R1-R2, R2-R3, and R3-R4 were 0.080, 0.097, and 0.060 m/d, respectively. The high values of water release of the fourth gauging station in the first stage may be caused by surface crust layer and the interstitial air initially entrapped in the unsaturated zone which promoted the water infiltration (Nazoumou and Besbes, 2000; Tu et al., 2011).
| Table 1 Stage of the recharge operation from 1 March to 15 August 2006 |
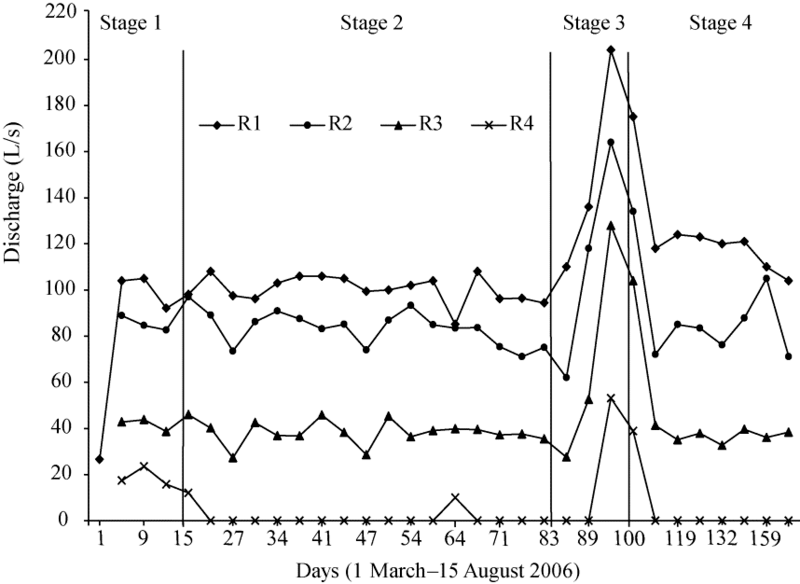 | Fig. 4 Flow hydrograph measured at four gauging stations (R1, R2, R3, and R4) along the Saadinewadi |
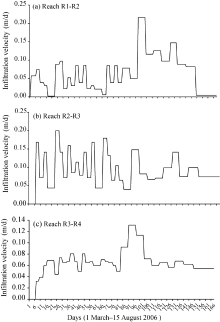
Figure 5 shows the evolution of the infiltration velocity during the recharge time. The average infiltration velocities in the reaches R1-R2, R2-R3, and R3-R4 were 0.050, 0.127, and 0.043 m/d, respectively. The recharge volume estimated by the analytical method was about 90% of total water volume released.
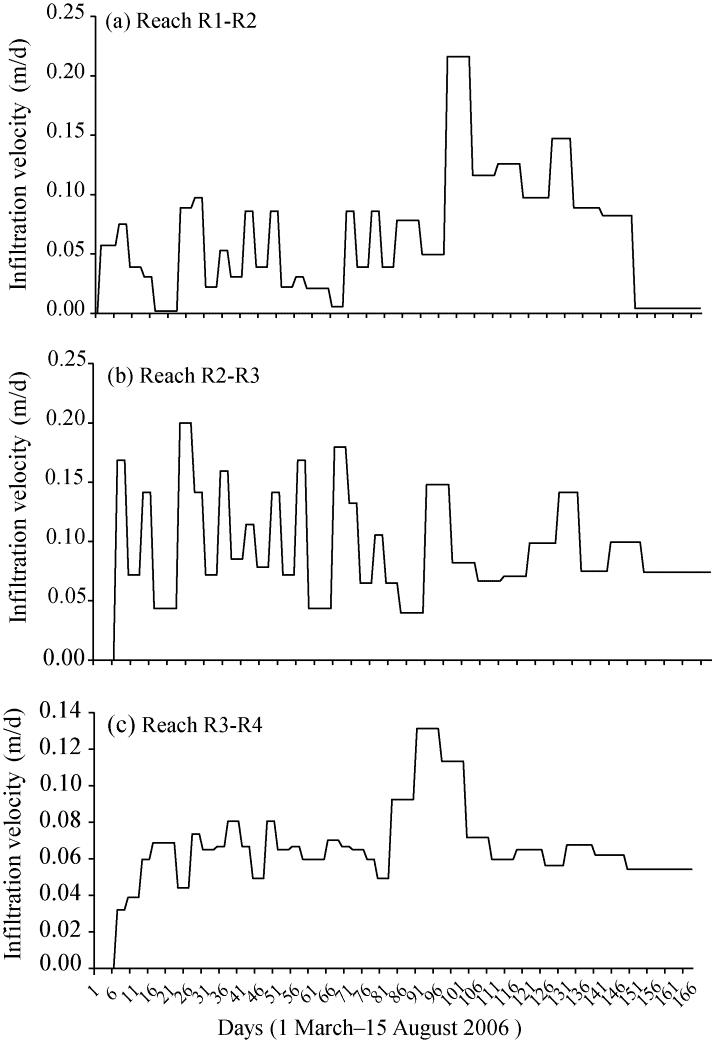 | Fig. 5 Infiltration velocity in the reaches R1-R2 (a), R2-R3 (b), and R3-R4 (c) |
Table 2 shows the general characteristics of the stream reaches. The infiltration indices at the reaches R1-R2, R2-R3, and R3-R4 were 8.8, 11.8 and 7.6 L/(s• km), respectively. The highest infiltration index was found in the reach R2-R3 mainly characterized by the highest number of infiltration ponds, the greatest degree of sinuosity and a flat topography. The lowest value occurred in the reach R3-R4 principally characterized by the absence of infiltration ponds.
| Table 2 General characteristics of the stream reaches |
3.1.1Lithology and land use
The lithology of the unsaturated zone above the groundwater table is important for aquifer recharge (Shaban et al., 2006; Yeh et al., 2009). Lithology in theSaadinewadiis mainly composed of sandstones and conglomerates of the upper Oligocene and Miocene. These sandstones and conglomeratesare excellent for water percolation.
Generally speaking, the land use is also an important factor in groundwater recharge (Leduc et al., 2001; Boulain et al., 2009; Descroix et al., 2012; Liu and Shao, 2016). All stream reaches are covered with similar grass and vegetation types and the effect of land use ongroundwater recharge can thus be negligible.
3.1.2Stream slope
The slope is considered as a significant factor in determining the infiltration recharge. Generally, the water infiltration decreases as the slope steepness increases (Konkul et al., 2014). A digital elevation model (DEM) was used to carry out the slope analysis using the AarGIS9.3 software. The upstream portion(mainly R1-R2reach) is steep and less favorable for infiltration. And, the downstream portion (includingreaches R2-R2 and R3-R4) is a rather flat area and more favorable for infiltration (Figs. 3 and 6a).
 | Fig. 6 Maps ofstream slope (a) and unsaturated zone thickness (b) |
3.1.3Unsaturated zone thickness
The water recharge velocity is directly related to the thickness of the unsaturated zone (Flint and Ellet, 2004; Rushton, 2005; Lee et al., 2006). In the study site, the thickness of the unsaturated zone was delineated using the data from total of 179 pumping wells and piezometers. The thickness ranges from 12 to 114 m in the Saadinewadi. The thickness is 61-70m for R1-R2 reach, 41-60 m for R2-R3 reach, and 12-40 m for R3-R4 reach (Fig. 6b).
3.1.4Streambed geometry
The streambed geometry (Si) quantifies the sinuosity degree of the wadi. Si is calculated as the ratio of the channel to the straightline valley lengths. For Saadinewadi the Si ranges between 1.24 and 1.43. The values of Si calculated for the reaches R1-R2, R2-R3, and R3-R4 are 1.29, 1.43, and 1.24, respectively. That is, the third reach has the shortest travel time of water flow and the infiltration may thus be limited, the second reach has the longest travel time of water flow and the infiltration is thus favored.
By applying the Pearson’ s correlation matrix for surface and subsurface streambed characteristics, we found a significant correlations between stream slope and water flow rate (R2=0.957). The correlation betweeninfiltration index and infiltration pond number is rather robust (R2=0.908) andthe correlation between infiltration index and streambed geometry(R2=0.999) is also robust (Table 3). In addition, the stream slope and unsaturated zone thickness is also well correlated (R2=0.931).
| Table 3 Pearson’ s correlation matrix for streambed characteristics |
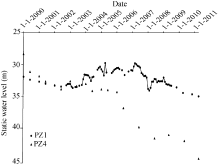
The variations of groundwater level for the piezometers Pz1 and Pz4 during the 2000-2011 period is shown in Figure 7. The piezometer Pz1, located near the river bed, recorded three phases of variations. The first phase displayed a continuous decrease of about 2.21mm/d of the groundwater level until the end of 2002. The second phase started in2003 with an increasing groundwater level due to the operation of artificial recharge, and the groundwater level maintained at a rather high level until the end of 2007.It should be pointed out that the water table presented an increasing rate of 5 mm/d in April and May 2006. However, the water table showed a decreasing rate of 7 mm/d in June and July2006 due to the irrigation water demand and high evaporation. The third phase suggested that the groundwater level declined continuously due to the groundwater over-exploitationsince 2007, especially in the year of 2008. On the other hand, the piezometerPz4, located at 4.5 km far from the recharge site, showed a decrease of 7 mm/d before 2002 and a slight decrease rate of 0.3 mm/d from October 2004 to May 2006. Then the groundwater level declined sharply with a mean of 10 mm/d from 2006 to 2011. The results ofvariations in groundwater levelimply that artificial recharge can only affect a rather limited area. In other words, the downstream area became vulnerable to the shortage of groundwater in recent years and reached a critical stagebecause the exploitation is greater than recharge. Groundwater level decline has already led to serious water scarcity during dry years. In addition, the dry season (i.e., summer), also irrigation-related water-demanding season, is not the best season for the practice of artificial recharge and it is thus recommended to start the artificial recharge during the wet (i.e., winter) season.
 | Fig. 7 Groundwater level variations in piezometers Pz1 and Pz4 of Nadhour-Saouaf aquifer |
Our results confirmed that artificial recharge from rainwater harvesting systems can increase the groundwater level for providing supplementary irrigation-needed water during dry season and the direct method to estimate aquifer artificial recharge can improve the efficiency of the recharge operations in the future.
The aquifer recharge estimation is critical for efficient groundwater management. The method presented in this article aimed to estimate potential artificial recharge and to determine its controlling factors. For higher infiltration velocity in the streambed, the optimum water flow release was determined through the measured hydrograph. Hence, the efficient water flow rate was around120 L/s. The average infiltration velocities in the reaches R1-R2, R2-R3, and R3-R4 were 0.080, 0.097, and 0.060 m/d, respectively. The positive relationship demonstrates that the number of infiltration ponds and streambed geometry are the most determinant factors as they are highly correlated to the infiltration index with correlation coefficients of 0.908 and 0.999, respectively.
The variations of groundwater level during 2000-2011 period for the piezometers Pz1 and Pz4 were used to assess the recharge effects on the hydrodynamic of aquifer. The piezometer Pz1 showed a limited groundwater increase in response to the operation of artificial recharge in April and May 2006. Since 2007, the groundwater level has continuously declined due to the over-exploitation of groundwater. Thus, artificial recharge effects appeared to be limited in both time and space.
The actual artificial recharge value was estimated to be 0.5 mm/d according to the increase of water amount during 120-day artificial recharge. Despite the partial success of the experiment, building infiltration ponds along streambed and improving the potential of rainwater harvesting all over the study area are recommended to mitigatewater shortage problems resulted from the intensive groundwater exploitation.
The authors are immensely grateful to the anonymous reviewers and editorial team of the Journal of Arid Land for their comments and suggestions that enhanced the quality of the paper.
The authors have declared that no competing interests exist.
| 1 |
|
| 2 |
|
| 3 |
|
| 4 |
|
| 5 |
|
| 6 |
|
| 7 |
|
| 8 |
|
| 9 |
|
| 10 |
|
| 11 |
|
| 12 |
|
| 13 |
|
| 14 |
|
| 15 |
|
| 16 |
|
| 17 |
|
| 18 |
|
| 19 |
|
| 20 |
|
| 21 |
|
| 22 |
|
| 23 |
|
| 24 |
|
| 25 |
|
| 26 |
|
| 27 |
|
| 28 |
|
| 29 |
|
| 30 |
|
| 31 |
|
| 32 |
|
| 33 |
|
| 34 |
|
| 35 |
|
| 36 |
|
| 37 |
|
| 38 |
|
| 39 |
|
| 40 |
|
| 41 |
|
| 42 |
|
| 43 |
|
| 44 |
|
| 45 |
|
| 46 |
|
| 47 |
|
| 48 |
|
| 49 |
|
| 50 |
|
| 51 |
|
| 52 |
|
| 53 |
|
| 54 |
|
| 55 |
|
| 56 |
|
| 57 |
|
| 58 |
|