Sand particle lift-off velocity measurements and numerical simulation of mass flux distributions in a wind tunnel
[XIAO Fengjun1, *  , DONG Zhibao
1 , GUO Liejin2 , WANG Yueshe2 , LI Debiao2, 3 ]
, DONG Zhibao|
|


Lift-off velocity of saltating sand particles in wind-blown sand located at 1.0 mm above the sand bed surface was measured using a phase Doppler particle analyzer in a wind tunnel. The results show that the probability distribution of lift-off velocity can be expressed as a lognormal function, while that of lift-off angle follows an exponential function. The probability distribution of lift-off angle conditioned for each lift-off velocity also follows an exponential function, with a slope that becomes steeper with increasing lift-off velocity. This implies that the probability distribution of lift-off velocity is strongly dependent on the lift-off angle. However, these lift-off parameters are generally treated as an independent joint probability distribution in the literature. Numerical simulations were carried out to investigate the effects of conditional versus independent joint probability distributions on the vertical sand mass flux distribution. The simulation results derived from the conditional joint probability distribution agree much better with experimental data than those from the independent ones. Thus, it is better to describe the lift-off velocity of saltating sand particles using the conditional joint probability distribution. These results improve our understanding of saltation processes in wind-blown sand.
The probability distribution of sand particles’ lift-off velocity plays an important role in defining the mechanisms of saltation. It specifies the initial lift-off conditions for saltating sand particles, exerts a major influence on the modeled trajectories, and in turn, reflects the distribution of mass flux (Bagnold, 1941; Anderson and Hallet, 1986; Nalpanis et al., 1993; Namikas, 2003; Dong et al., 2004; Xie et al., 2006; Rasmussen and Sø rensen, 2008; Kok and Renno, 2009; Ho et al., 2014; Rasmussen et al., 2015). Although many researches have been done, there are still controversies on lift-off velocity. One is the choice of functions describing the probability distributions of lift-off velocity and lift-off angle (especially for low velocities and small angles). Another is the relationship between the probability distributions of lift-off velocity and the lift-off angle (i.e., whether they are treated as independent joint or conditional joint distributions). It is therefore crucial to have an accurate measurement and description of the lift-off velocity and angle probability distributions.
There are two general approaches to obtain the lift-off velocity and lift-off angle for saltating sand particles in a wind-blown sand flux. They are numerical modeling (Anderson and Haff, 1988; Haff and Anderson, 1993; Zheng et al., 2008) and experimental measurements in a wind tunnel (White and Schulz, 1977; White, 1982; Nalpanis et al., 1993; Nishimura and Hunt, 2000; Zou et al., 2001; Dong et al., 2002, 2004; Cheng et al., 2006; Xie et al., 2006; Zhang et al., 2007, 2014; Kang et al., 2008a; Rasmussen and Sø rensen, 2008; Creyssels et al., 2009; Ho et al., 2012; Bo et al., 2013). In the numerical modeling, it is necessary to establish a collision model to introduce assumptions and simplifications on sand particle properties (stiffness, damping coefficient, friction coefficient, and shape, etc.), making the results less reliable than those of experimental measurement. Thus, we focus on the experimental approach in this paper.
Photographic method (cinematic photography, multiple-image photography, high-speed photography, particle image velocimetry) and laser Doppler method (laser Doppler velocimetry (LDV), phase Doppler anemometry (PDA), phase Doppler particle analyzer (PDPA)) are two major methods to measure particle velocity. Photographic method can measure particle velocities at different locations within a target area, but it is difficult to deduce the sand particle’ s velocity information at very low height (less than 5 mm) where the particle concentration is too high (Nalpanis et al., 1993; Cheng et al., 2006; Ho et al., 2012; Bo et al., 2013). Laser Doppler method is used to measure the speeds of sand particles at a fixed point, thus being an acceptable method to measure the speeds at higher particle concentrations near the sand bed surface.
Nalpanis et al. (1993) employed multiple-image photography to evaluate the motions of saltating sand particles that impact and leave the sand bed surface and found that both the probability distributions of the lift-off velocity and the lift-off angle follow a lognormal distribution function. Cheng et al. (2006) found that the lift-off velocity follows a Gamma function, whereas the lift-off angle follows a LogNorm4 function. Ho et al. (2012) found that the vertical lift-off velocity deviates significantly from a Gaussian function and exhibits a long tail that was accurately described by a lognormal function, but they did not show the probability distribution of lift-off angle. Bo et al. (2013) performed a particle image velocimetry experiment in a wind tunnel and reported that both the horizontal and vertical lift-off velocities follow a lognormal function.
Dong et al. (2004) measured the sand particle velocity in a wind tunnel using a PDA and found that the horizontal velocity follows a Gaussian function and the vertical velocity follows a Lorentzian function for fine particles. Dong et al. (2004) also found that the lift-off velocities cannot be simply described by a simple function for coarse particles. The measurements by Xie et al. (2006) found that both the horizontal and vertical lift-off velocities can be described by the Gamma function. Kang et al. (2008a) suggested that the probability distribution of lift-off velocity follows a lognormal function, while the lift-off angle complies with an exponential function. Their results were based on measurements using a PDPA, a technique similar to that used in Dong et al. (2004).
Many researchers have used the probability distribution of lift-off velocity to simulate the distribution of sand mass flux based on numerical modeling results and experimental results (Nalpanis et al., 1993; Nishimura and Hunt, 2000; Namikas, 2003; Xing and Guo, 2004; Cheng et al., 2006; Kang et al., 2008b; Rasmussen and Sø rensen, 2008; Feng et al., 2009; Kok and Renno, 2009; Ho et al., 2014). In all these simulations, the probability distribution of lift-off velocity is assumed to be independent of the probability distribution of lift-off angle. In other words, all the sand particles lifting-off at any given velocity must follow the same probability distribution of lift-off angle. This is clearly not the case. In reality, researchers have found that the average lift-off velocity increases monotonically with impacting velocity, and that the same is true for the average lift-off and impacting angles (White and Schulz, 1977; Dong et al., 2002; Kang et al., 2008a); thus, the lift-off sand particles with high velocity will gain more momentum and impact the sand bed with small impacting angles. This suggests that high-velocity lift-off sand particles launch with small lift-off angles, while the low-velocity ones launch with large lift-off angles. Therefore, the probability distributions of lift-off velocity and lift-off angle are inter-dependent and a conditional joint probability distribution must be used. In this paper, the probability distributions of lift-off velocity and lift-off angle, as well as the conditional and independent joint probability distributions, are analyzed based on measurements carried out using a PDPA in a wind tunnel. In addition, numerical simulations are carried out to simulate the vertical distribution of sand mass flux, in which the conditional and independent joint probability distributions are used as initial parameters. Finally, we compare these simulated results with our experimental data.
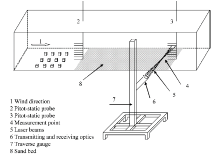
All experiments were conducted in a blow-type non-circulating wind tunnel at the State Key Laboratory of Multiphase Flow in Power Engineering, Xi’ an Jiaotong University, China. The test section of the wind tunnel is 0.40 m wide and 0.60 m high. The free-stream wind velocities in the wind tunnel were varying continuously between 1 and 40 m/s. Layout of instrumentation for the wind tunnel experiment is shown in Figure 1.
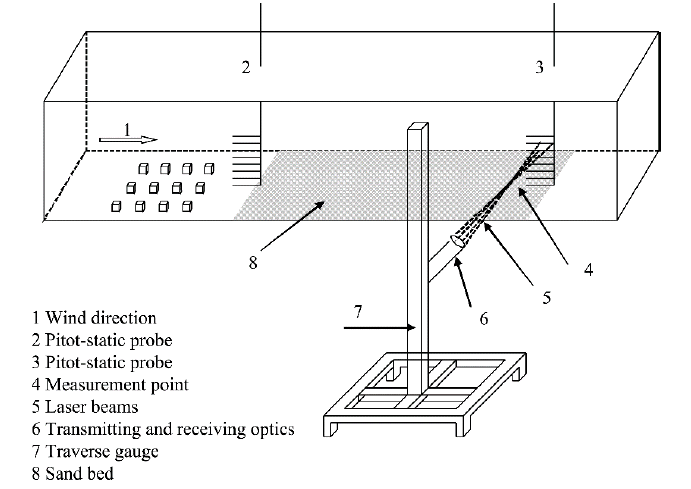 | Fig. 1 Layout of the instrumentation for the wind tunnel experiment |
Natural quartz sand was sieved into three size groups for tests: 0.200-0.300, 0.300-0.355, and 0.355-0.450 mm. A 0.045-m thick layer of sand was evenly spread along the 4.0 m long wind tunnel bed to create a sufficiently thick saltation layer.
Free-stream wind velocity and the wind velocity profile were determined using two arrays of seven calibrated pitot-static probes at the start and the end of the wind tunnel test section. The seven selected velocity measurement heights were: 0.03, 0.05, 0.07, 0.09, 0.11, 0.13, and 0.15 m. The thickness of the boundary layer at the experimental site was about 0.15 m. The wind velocity profiles show a log-linear relationship (0.03-0.15 m), and the wind friction velocity was estimated from this relationship.
The velocities of saltating sand particles located at 1.0 mm above the sand bed surface and at 0.20 m from the pitot-static probes upwind were measured by a PDPA (TSI Inc. USA). PDPA measured both the horizontal and vertical velocity components by the blue and green beams separately, and thus the coincident mode was used to obtain the horizontal and vertical velocity components of the same sand particle. The resultant velocity and angle of the saltating sand particle could be computed ( 
In total, we obtained 12 sets of experimental data. The measurements in each set were repeated 3-5 times to obtain sufficient data to investigate the conditional joint probability distribution of lift-off velocity and angle. We determined more than 7000 lift-off velocities and angles for each set.
| Table 1 Settings used for the phase Doppler particle analyzer in the experiment |
We distinguish lift-off sand particles from the other particles by their vertical velocity. If the vertical velocity is upwards, then the particle is classified as a lift-off sand particle.
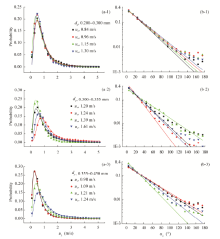
The probability distributions of lift-off velocity for saltating sand particles are shown in Figures 2a-1, -2 and -3. The regression analysis shows that the curves comply with a lognormal function as Equation 1.
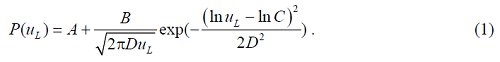
Where P(uL) is the probability density, uL is the resultant lift-off velocity of saltating sand particles, and A, B, C and D are the regression coefficients. The values of R2 in Table 2 are larger than 0.98, suggesting that Equation 1 well fits the observed data for all 12 data sets.
| Table 2 Fitting parameters of the probability distributions of lift-off velocity and lift-off angle |
 | Fig. 2 Probability distributions of (a-1, -2, -3) lift-off velocity (uL) and (b-1, -2, -3) lift-off angle (α L). dp, diameter of sand particles; u* , wind friction velocity. |
It can be found that all the probability distribution curves have a peak at small velocities (Figs. 2a-1, -2 and -3). This is consistent with the descriptions by some other researchers (White and Schulz, 1977; Nalpanis et al., 1993; Zou et al., 2001; Zhang et al., 2007; Kang et al., 2008b), but inconsistent with studies that recorded a monotonic decreasing function. It should be noted that both sets (consistent and inconsistent) were measured with similar techniques and methods (Dong et al., 2002; Xie et al., 2006). These discrepancies may be caused by the lack of understanding on the effects of wind tunnel parameters, such as the size of the working section, fetch length, the boundary height of the wind tunnel, and so on.
The probability distributions are very close for dp of 0.200-0.300 mm sands in Figure 2a-1. This suggests that the mean lift-off velocity is constant and independent of the wind friction velocity (Namikas, 2003, 2006; Andreotti, 2004; Creyssels et al., 2009; Kok and Renno, 2009; Kok, 2010; Ho et al., 2012, 2014). But, for dp of 0.355-0.450 mm sands, the probability distributions in Figure 2a-3 widen with increasing wind friction velocity; the peak value and the probability of high lift-off velocity increase; and the probability of small lift-off velocity decreases, suggesting that the mean lift-off velocity increases with increasing wind friction velocity. This is consistent with the results that mean lift-off velocity is positively related with the wind friction velocity (Bagnold, 1941; Anderson and Hallet, 1986; McDonald and Anderson, 1995; Dong et al., 2004; Feng et al., 2009), being contrary to what we have found for dp of 0.200-0.300 mm sands. For dp of 0.300-0.355 mm medium size sands, there is a similar trend but not as clear as that for dp of 0.355-0.450 mm sands. The contrary results can be attributed to the accelerating effects of airflow on sand particles and the influence of the lowered sand bed surface. The energy transferring from airflow to sand particles increases with the increasing wind frictional velocity. Accordingly, the horizontal component of lift-off velocity of sand particles increases. The vertical component of lift-off velocity is almost invariant with wind friction velocity (Rasmussen and Sø rensen, 2008; Ho et al., 2012). Thus, these make the probabilities of these highly energetic sand particles whose resultant lift-off velocities are largely increased. In addition, experimental studies found that the mean horizontal sand particle velocity increases with height and also with wind friction velocity, and its profiles tend to converge at a height near the bed (Dong et al., 2004; Kang et al., 2008c; Creyssels et al., 2009; Ho et al., 2011). The mean horizontal sand particle velocity will increase if the sand bed surface is lowered. In our experiments, the free-stream wind velocities for dp of 0.355-0.450 mm sands are a little larger than the other two sands (i.e., dp values of 0.200-0.300 and 0.300-0.355 mm). It makes the sand bed surface lowered more quickly, though we have reduced the duration of the experimental time and increased the experimental repetition times to eliminate the effects of the lowered sand bed surface when we do the experiments for dp of 0.355-0.450 mm sands. Therefore, the larger observation heights make the observed horizontal component of the lift-off velocity accordingly large and the mean resultant lift-off velocity increases with increasing wind friction velocity.
Size grading also influences the particle velocity. Lift-off velocity varies with particle size in a mixed-size sand, and large particles leave the bed surface with a smaller velocity on average than fine particles (McEwan et al., 1992; Namikas, 2006). The experiments of Bo et al. (2013) show that the diameter of sand particles has no obvious influence on the distribution shape of lift-off velocity, but it has obvious influences on the parameters of the distribution function. A conceptual model of particle-bed collision has been developed by Namikas (2006) to account for the partitioning of impacting energy between rebounding particles and the sand bed surface, in which a quasi-elastic regime at low impacting velocity and an inelastic regime at high impacting velocity are used to explain the particle-bed collisions. The results by Namikas (2006) suggest that particles rebound with an approximately constant level of kinetic energy regardless of particle diameter in the inelastic regime. In practice, the lift-off sand particles could have a range of velocities, being changeable from small to large no matter what the size grading is. It means that both the inelastic regime and the quasi-elastic regime may coexist during the aeolian sand transport.
The probability distributions of lift-off angle of saltating sand particles are shown in Figures 2b-1, -2, and -3. We can see that the probability density decreases with an increase in lift-off angle, which can be expressed by an exponential function (Eq. 2).

Where P(α L) is the probability density, α L is the lift-off angle of saltating sand particles, and E and F are the regression coefficients.
Backward lift-off sand particles also are detected in Figures 2b-1, -2, and -3, as their lift-off angles are larger than 90° . This is the result of intensive inter-particle collisions and backward ejection of lift-off sand particles from the sand bed surface. The mean proportion of the backward lift-off sand particles is about 7%, being in fair agreement with the experimental results of Willetts and Rice (1986) and Kang et al. (2008a). Interestingly, the probability distributions of backward lift-off sand particles deviate from the exponential function and are almost constant when lift-off angle is larger than 120° .
The independent joint probability distribution of lift-off velocity and angle is the multiplication of the probability distribution of lift-off velocity and that of lift-off angle (Eq. 3).
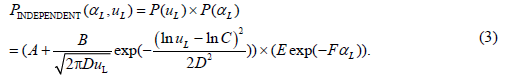
Where PINDEPENDENT(α L, uL) is the probability density of sand particle lift-off velocity (uL) and lift-off angle (α L), P (uL) and P (α L) are the probability densities of lift-off velocity and lift-off angle, which has been mentioned in Equations 1 and 2.
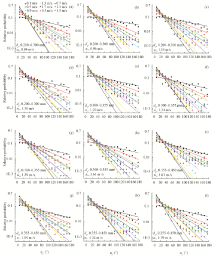
The relative probability distribution of lift-off angle for each lift-off velocity is shown in Figure 3. The distribution is quite similar to the distribution of lift-off angle in Figures 2b-1, -2, and -3, and can be expressed by an exponential function (Eq. 4).

Where PRELATIVE(α L|uL) is the relative probability density for the lift-off velocity uLi; G and H are the regression coefficients. We define PRELATIVE(α L|uLi) as PCONDITIONAL(α L, uLi) divided by P (uL).
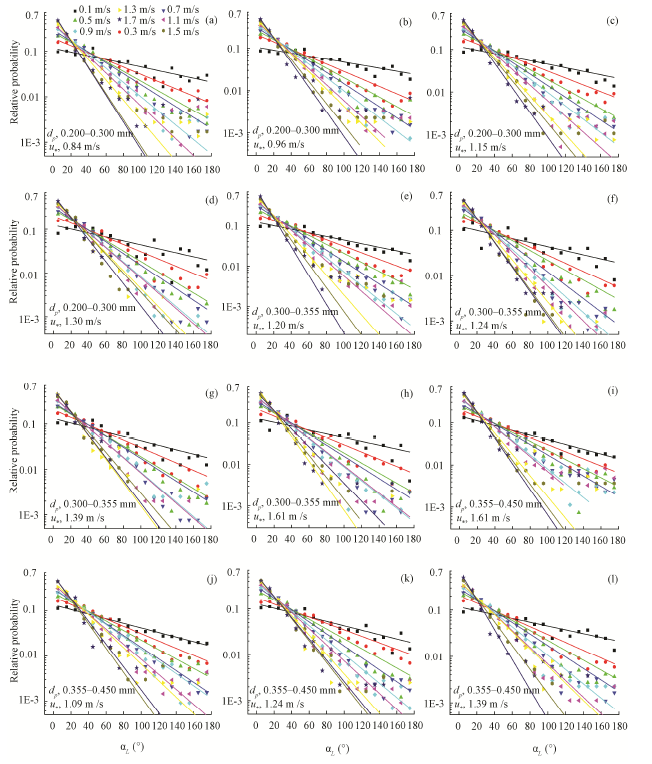 | Fig. 3 Relative probability distributions of lift-off angle (α L) for different lift-off velocities (0.1-1.7 m/s) |
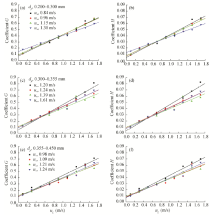
The relationships of G and H (both being the regression coefficients) with lift-off velocity uL are shown in Figure 4. It can be seen that both G and H increase linearly with lift-off velocity uL: G(or H)=a+buL. Regression coefficients for this relationship are listed in Table 3.
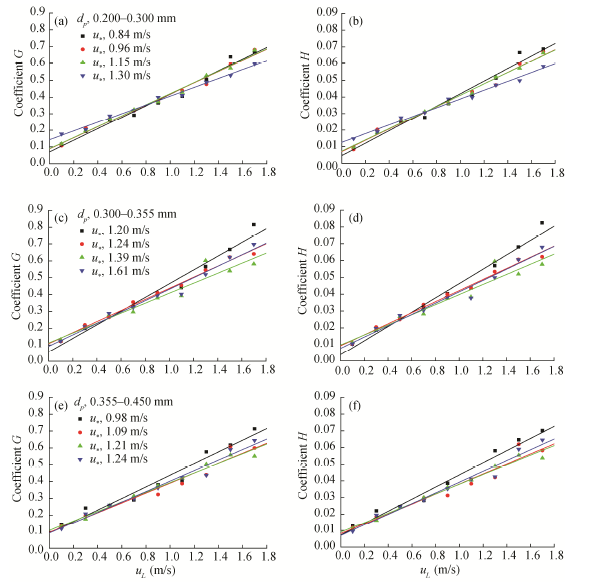 | Fig. 4 Relationships between the regression coefficients (G andH) of the relative probability distribution with lift-off velocity |
The conditional joint probability distribution of lift-off velocity and lift-off angle can be described by Equation 5.
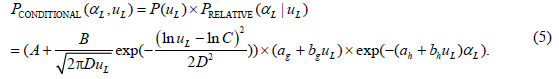
Where PCONDITIONAL(α L, uL) is the probability density of sand particle lift-off velocity and lift-off angle, and their regression coefficients are listed in Tables 2 and 3, respectively.
The curves of the probability distribution of lift-off angle in semi-log coordinate are straight lines in Figure 3. The relative decay rate (-H) decreases with the increasing lift-off velocity. It indicates that the mean lift-off angle deceases with increasing lift-off velocity. This is consistent with the experiment results of White and Schulz (1977), Dong et al. (2002) and Kang et al. (2008c). In light of statistics, the lift-off sand particles are mainly coming from the rebounding of impacting sand particles especially for high speed sand particles, and only a few from ejecting ones (usually corresponding to low speed sand particles). High-velocity lift-off sand particles will gain much more momentum than low-velocity ones, and will accelerate in the downwind direction, striking the sand bed with small impacting angles, and rebounding with small lift-off angles.
In addition, our results also show that the probability distributions of backward lift-off sand particles for all lift-off velocities deviate from the exponential function and are invariant when lift-off angle is larger than a specific angle. This specific angle decreases from 180° to 90° with increasing of lift-off velocity from 0.1 to 1.7 m/s.
| Table 3 Fitting parameters of the relative probability regression coefficients for different sand particle diameters and wind friction velocities |
A numerical simulation is used to simulate the relative proportion of the vertical distribution of sand mass flux. We use both the conditional and independent joint distributions of lift-off velocity and angle as initial conditions. Wind field modification is not needed because we start to measure the velocity of sand particles when the wind-blown sand flux reaches its equilibrium state.
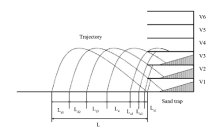
The model is an analogue of a sand trap in the wind tunnel, in which the trap is placed at the downwind end of test section (Fig. 5), being the same configuration as described by Namikas (2003) and Ho et al. (2014). The calculation processes are: (1) a sand particle’ s lift-off velocity and angle are selected, and its trajectory is calculated by solving the trajectory equations and wind velocity profile equations iteratively; (2) the relative proportion of this trajectory passing through each vertical interval compartment is determined by superimposing the calculated trajectory whose lift-off positions range from immediately in front of the trap to an upwind distance equal to the trajectory length; (3) the contributions of this trajectory to each compartment are weighted by its joint probability density of lift-off velocity and angle; and (4) the process is repeated for each lift-off velocity and angle. The overall mass flux distribution is determined by summing these contributions for 60 lift-off velocities and 60 lift-off angles (3600 trajectories), representing the joint launch velocity and angle distributions.
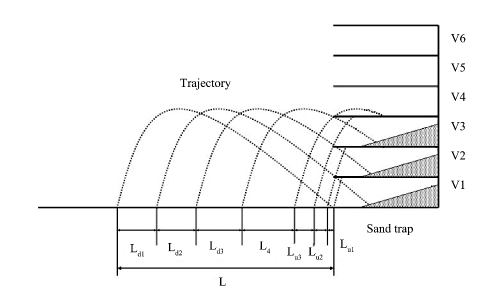 | Fig. 5 Contribution of a trajectory to mass flux distribution. L, trajectory length; Ld1, Ld2 and Ld3, descending parts of the trajectory length contributed to each vertical interval compartment (V1, V2 and V3); Lu1, Lu2 and Lu3, ascending parts of the trajectory length contributed to each vertical interval compartment (V1, V2 and V3); L4, parts of the trajectory length contributed the vertical interval compartment (V4). |
Only gravity and aerodynamic drag force are considered in the calculation of particle trajectories. The influence of the wind turbulence on particle trajectories can be neglected if the sand particle diameter is equal to or greater than 0.10 mm, and the particle diameters are all greater than 0.10 mm in this study. The trajectories of saltating sand particles are specified by Equations 6-8.
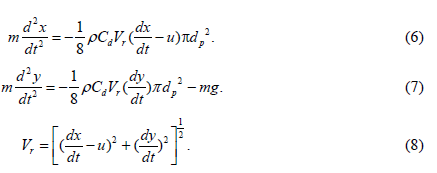
Where x and y are the horizontal and vertical coordinates of the sand particle, m and dp are the mass and diameter of the sand particle, ρ is the air density, Cd is the drag coefficient, Vr is the relative velocity of the sand particle and air, u is the wind velocity, g is the gravitational acceleration, and t is the time. Drag coefficients are specified using the functions proposed for spheres by Morsi and Alexande (1972).
The measured wind velocity profile in the test section is well fitted with the logarithmic law and is described by Equation 9.
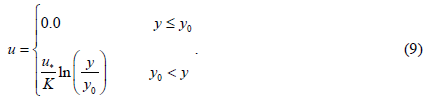
Where u is the mean streamwise velocity as a function of height above the sand bed surface, K is the von Ká rmá n constant (taken as 0.4), u* and y0 are the wind friction velocity and effective roughness length of the sand bed surface, and these values derived from curve fitting of experimental data are listed in Table 4.
| Table 4 Comparison of the decay rate for experimental and simulated vertical distributions of mass flux derived from the conditional and independent joint probability distributions and fitting parameters of the wind speed profile |
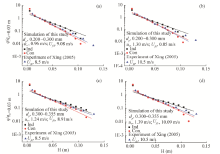
The experimental and simulated vertical distributions of mass flux are shown in a log-linear coordinate system in Figure 6. We can find that all the vertical distributions of mass flux above 0.02 m follow an exponential distribution. This distribution form is also found by other researchers (White, 1982; Nalpanis et al., 1993; Dong et al., 2003; Namikas, 2003). In this study, only the mass flux above 0.02 m is used in the comparison with experimental data. There are two major reasons. First, the sand trap is an intrusive measurement instrument, which makes the sand mass flux below 0.02 m not very reliable; and second, the mass flux near the sand bed is deviated from the exponential function. In order to compare with the experimental data, the measured and simulated mass fluxes are all scaled by the mass flux at 0.03 m height, and qh=0.03 m is the mass flux at 0.03 m height.
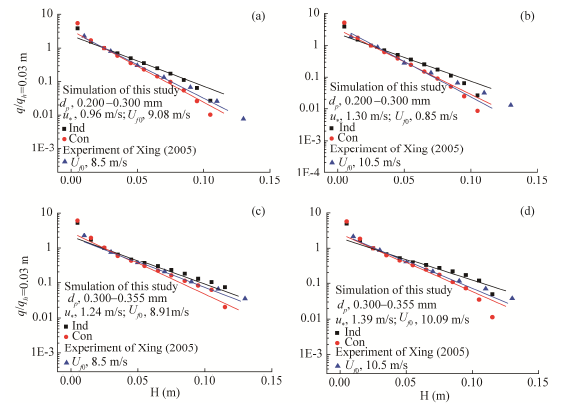 | Fig. 6 Comparison of experimental and simulated vertical distributions of mass flux using the independent (Ind) and the conditional (Con) joint probability distributions of the lift-off velocity and angle |
The vertical distribution of sand mass flux can be described with the following exponential function (Eq. 10).

Where q is the sand mass flux at a height of y; a and b are regression coefficients.
The coefficient b in Equation 10 represents the relative decay rate or the slope of the sand mass flux with height. Using least squares curve-fit method for the mass flux above 0.02 m, the relative decay rates b of the simulation and experimental data are calculated and their values are listed in Table 4.
There is no reliable way to quantitatively compare the data from different wind tunnel experiments due to the variable experimental conditions (e.g., wind velocity, sand particle diameter, and distribution). Hence, only experimental data from the same wind tunnel under similar experimental conditions from Xing (2005) are used for comparison.
The mass flux distributions derived from the conditional probability distributions decay more rapidly than those derived from the independent probability distributions, the mean difference of decay rate being as large as 47.0%. In addition, the mass flux distributions derived from the independent joint probability distributions deviate significantly from the experimental results, the mean difference of decay rate being 39.2%. The mass flux distributions derived from the conditional joint probability distributions agree very well with our experimental results, the mean difference of decay rate being only 5.8%. It should be noted that this difference (5.8%) is smaller than the mean differences of decay rate 7.6% (Namikas, 2003) and smaller than the mean difference of decay rate 8.2% (Kang et al., 2008b). This can be explained by the fact that sand particles with large velocities tend to accumulate at the lower part of the mass flux. That is, the mean height of trajectories for sand particles of large velocity decreases as the mean lift-off angle decreases with the increasing lift-off velocity, thus making the distribution of mass flux decays with height more quickly.
Using a PDPA, the lift-off velocity of saltating sand particles located at 1.0 mm above the sand bed surface was determined. A numerical simulation was established to model the vertical distributions of mass flux using these lift-off velocities as initial parameters. Based on the experimental data and simulation results, we concluded that the probability distribution of lift-off velocity can be described by a lognormal function, while the probability distribution of lift-off angle complies with an exponential function. These two distributions are inter-dependent. Lift-off angles follow an exponential distribution for any given lift-off velocity. As the lift-off velocity became greater, the slope of this exponential distribution function steepened. The regression coefficients had a linear relationship with lift-off velocity. Thus, a conditional joint probability distribution should be used to describe the initial lift-off conditions of saltating sand particles.
The simulation results from the conditional joint probability distribution agree well with the experimental data, while those from the independent joint probability distribution deviate markedly. Thus, it is more accurate to describe the sand particles’ initial conditions using the conditional joint probability distribution than using more traditional and independent ones.
Sieved sands are used in the experiments and the influence of size grading on the particle velocity is neglected in this study. Therefore, further experimental study is needed to clarify the role of sand grading in the collision process.
This work was supported by the Fundamental Research Funds for the Central Universities of China (GK201503053) and the National Natural Science Foundation of China (41601002). We wish to thank Mr. WANG Yechun for his help with wind tunnel experiments.
The authors have declared that no competing interests exist.
| [1] |
|
| [2] |
|
| [3] |
|
| [4] |
|
| [5] |
|
| [6] |
|
| [7] |
|
| [8] |
|
| [9] |
|
| [10] |
|
| [11] |
|
| [12] |
|
| [13] |
|
| [14] |
|
| [15] |
|
| [16] |
|
| [17] |
|
| [18] |
|
| [19] |
|
| [20] |
|
| [21] |
|
| [22] |
|
| [23] |
|
| [24] |
|
| [25] |
|
| [26] |
|
| [27] |
|
| [28] |
|
| [29] |
|
| [30] |
|
| [31] |
|
| [32] |
|
| [33] |
|
| [34] |
|
| [35] |
|
| [36] |
|
| [37] |
|
| [38] |
|
| [39] |
|