HAN Yanlong, GAO Yong, MENG Zhongju, DANG Xiaohong, JIA Xu, DING Yanlong, LI Peng. , Effects of wind guide plates on wind velocity acceleration and dune leveling: a case study in Ulan Buh Desert, China. Journal of Arid Land, 2017, 9(5): 743-752.
The areas used to be covered by shifting sand dunes have been reclaimed rapidly in recent years. However, it is a challenge to reclaim high sand dunes because it is rather costly to level the high dunes to gentle arable lands. In this study, a wind guide plate was used to change the characteristics of natural wind to level the sand dunes. The use of wind energy could significantly increase the efficiency of dune leveling and decrease the cost. Low wind velocity is a typical characteristic in Ulan Buh Desert of China where the average wind speed is much lower than the threshold velocity for sand movement. The experiment of this study was conducted to accelerate the wind velocity by a wind guide plate to level a sand dune. Results show that the threshold velocity for sand movement is 3.32 m/s at 10 cm above the sand surface in Ulan Buh Desert. A wind guide plate set at an angle less than 50° could significantly increase the wind velocity. The wind velocity could be accelerated up to the threshold velocity for sand movement behind a plate when the plate is at the angles of 20°, 25°, 35° and 40°. The most significant acceleration of wind velocity appears at 1.5 and 3.0 m behind the plate with an angle of 25°. An obvious wind velocity acceleration zone exists behind the wind guide plate when the angles are at 25°, 35°, 40° and 45°, with the most obvious zone under the angle of 45°. The results also show that the total amount of sand transferred over the experimental period increased by 6.1% under the effects of wind guide plates compared to the sand moved without wind guide plates. The results of the study will provide theoretical and practical supports for desert management in sand dune areas.
Desertification resulted from climatic variability and human activities is a major environmental issue in arid areas, which induced the degradation of ecosystem services and threatened human living conditions (Wang et al., 2006; D’ Odorico et al., 2013). Desertification area accounts for one quarter of land areas on the earth and affects approximately 250× 106 people around the world (Reynolds et al., 2007; Wang et al., 2013). Sandy desertification makes up a great proportion in all types of desertification. Thus, worldwide efforts have been made to prevent and control sandy desertification by mechanical (Asi et al., 2002; Alghamdi and Al-Kahtani, 2005), biological (Zhang et al., 2004; Li et al., 2009), and chemical measures (Zang et al., 2015).
Generally, the movement of windblown sands in deserts is a major cause of sandy desertification. The role of wind in dune shaping has been widely studied. The different sand dune patterns, such as crescent, transverse, linear, feathery, and star dunes, are shaped by different wind speeds and wind directions (Fryberger and Dean, 1979; Wasson and Hyde, 1983; Livingstone and Warren, 1996; Zhang et al., 2010). Many studies have been conducted on sand flows at the surface of sand dunes, including sand moving velocity, saltation trajectory, particle size and aerodynamics, etc. (Huang and Zheng, 2001; Hesse and Simpson, 2006; Qu et al., 2012; Bruno and Fransos, 2015). Other factors affecting the formation and development of sand dunes include sand abundance and availability, ground surface characteristics, topography of the sand source and deposition areas, and the size of sand dunes (Craddock et al., 2015; Zang et al., 2015). Previous studies showed that 90% of windblown sands were transferred within 30 cm above the sand surface, of which approximate 90% was concentrated within the height of 10 cm (Bagnold, 1941; Wilson, 1994; Tan et al., 2013).
Although wind-caused sand movement is one of the major reasons for the formation of sand dunes, wind can also reduce the height of sand dunes. After the leveling, the sand dunes could be controlled by sand barrier and plants, and then be converted to non-sandy land for other purposes. Under normal conditions, the sand dune leveling always relies on large mechanical equipment such as bulldozer and excavator, which are often limited by traffic conditions and high cost. Wind is an abundant and free natural energy source in desert areas, which could be used to level the sand dunes with wind guide plates, and could significantly increase the efficiency of dune leveling and decrease the cost. However, there were few studies about the application of wind to reduce the height of sand dunes for the control or use of sand dunes. Some studies showed that the application of engineering and biological measures could effectively level the sand dunes to a lower height (Dong, 2005; Ying, 2007). However, these measures may not be applicable to the areas with huge and dense shifting dunes.
Wind guide plates have been widely used by industrial and mining enterprises to prevent wind and snow damages to roads (Wu, 2009) because the plates can effectively change the wind direction and increase the wind velocity. Wind guide plates have also been used in the desertification control, but there are few experimental and simulating studies on how wind guide plates can level sand dunes and reduce the dune height. The purpose of this study is to explore the feasibility of using wind guide plates to level sand dunes. We hypothesized that the wind velocity and wind direction can be changed and then to move the sands from the upper part to lower part at leeward of a sand dune, and the height of the sand dune will be leveled accordingly.
2 Material and methods
2.1 Study area
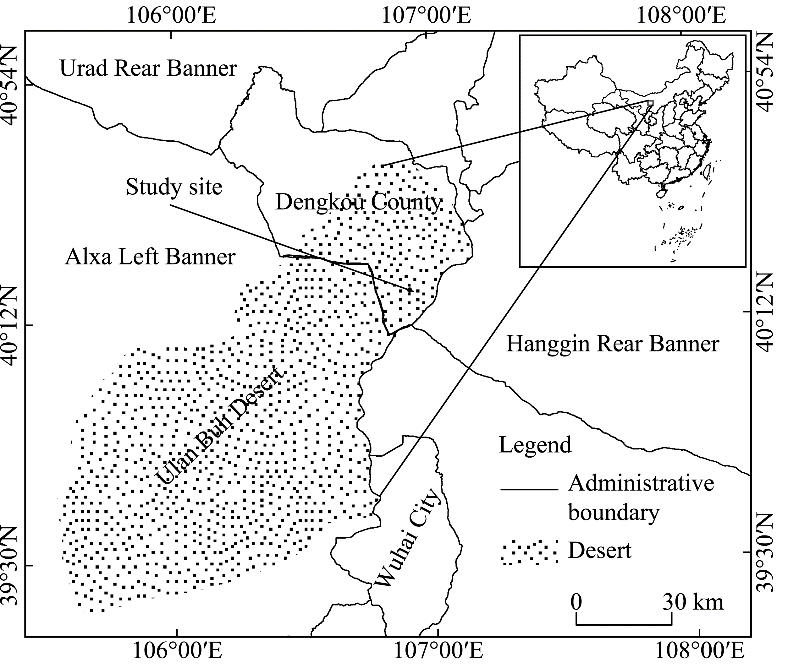
Ulan Buh Desert, the fourth largest sandy desert in China, is located in western Inner Mongolia (Fig. 1) with an area of 13× 103 km2. The main landscape in the desert is shifting sand dunes, which account for 80% of the total area of the desert. The huge sand dunes reach up to 17 m high and fine sands (0.10-0.25 mm) make up 90% of the surface sand particles. The area has an arid and semi-arid continental monsoon climate, with low precipitation, high evaporation and frequent winds. From 1956 to 2010, the annual mean temperature was 8.4° C, with the highest and the lowest temperatures at 32.9° C and -27.0° C, respectively. The mean annual precipitation was 142.7 mm with more than 50% falling in July to September. The prevailing wind directions are the west and southwest. The annual mean wind speed is 3.7 m/s. The strong winds occur from March to June, and the annual windy days is 12.5 d. The average number of days with sand storms are 10.9 d/a (Hao, 2007).
The experiment was conducted in southeastern Ulan Buh Desert from November 2015 to March 2016. The dominant wind direction was the northwest during the experimental period. Four typical sand dunes (A, B, C, D) were selected for observation. The selected dunes were close to one another and had similar heights and shapes. The sand dunes for the experiment were 10 m high, the windward slope was 28 m long and 18 m wide. The windward slope angle was around 20° . Dune A was used for determining the wind speed, B for setting a wind guide plate and measuring wind velocity, C for measuring the total amount of sand transferred over the windy season under the effects of a wind guide plate, and D was a control against C.
2.2 Experimental design and measurements
2.2.1 Wind velocity threshold for sand moving at 10 cm height (Experiment I)
Experiment I was conducted at the windward slope of Dune A to measure the wind velocity threshold for sand moving at 10 cm height above the sand surface. At the top of the sand dune, two wind velocity meters (10-channel HOBO RX3000, Onset Computer Corporation, USA) were installed to measure the wind speed and direction at the heights of 10 and 200 cm (Bao, 2015), respectively. The measured wind velocities were used to estimate the ground roughness. The measuring range was from 0 to 45 m/s, with a resolution of 0.38± 0.04 m/s. In this study, the threshold velocity for sand movement at the height of 10 cm was calculated based on the threshold velocity for sand movement at the height of 200 cm (Wang et al., 2013).
2.2.2 Wind velocities in front of, under, and behind wind guide plates (Experiment II)
Experiment II was set on the dunes A and B. A field experiment was conducted to measure the acceleration of wind velocities in front of, under and behind the wind guide plates, with the plate at different angles (the angle between the sand surface and the plate). The wind guide plates had adjustable bases and wooden board (1 m× 2 m).
The wind guide plates were set on the dune slope at 6 m away from the top of the sand dunes. Each experimental group had three wind guide plates and one control check. The plates were set at different angles. Initially, we set the angles at 15° , 30° , 45° and 60° , but the results were not desirable. Then we adjusted the angles between 15° -70° and identified 4 group angles: Group A, 15° , 30° , 45° ; Group B, 20° , 25° , 35° ; Group C, 40° , 60° , 70° ; and Group D, 50° , 55° , 65° . Each group had a control one.
Three steps were followed to make sure the accuracy of angles. The first step was to measure the dune morphology and to calculate the angle of windward slopes using a real-time kinematic GPS (RTK GPS, A20 GNSS, FOIF, China) and ArcGIS 10.2, respectively. The second step was to measure the angle between the dune surface and the plate using an electronic protractor that was calibrated with another protractor with the measuring repeated 5 times for each setting. The last step was to re-check the angle before each measurement.
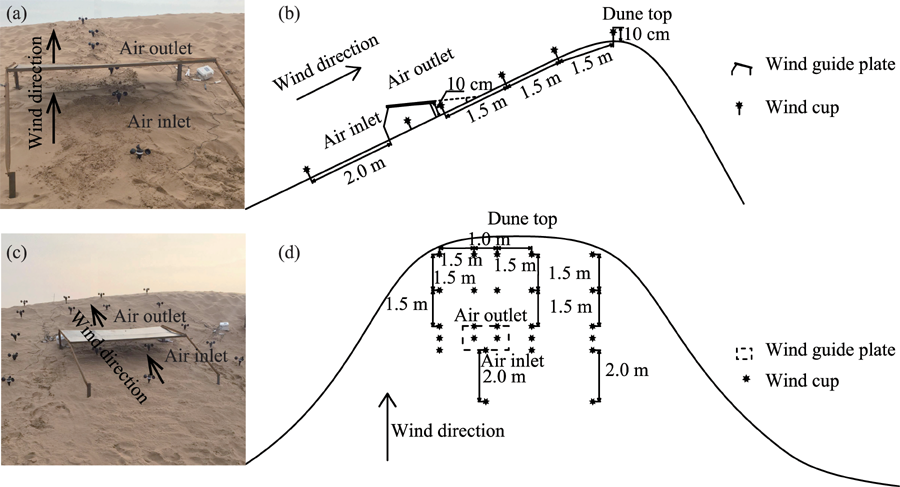
To measure the wind velocities in front of, under, and behind the plates, we installed a number of wind velocity meters along the axis of each wind guide plate. There were 1 meter at 2.0 m in front of the plate, 3 meters under the plate (at the air inlet and outlet, and under the central part of the plate), and 3 meters behind the plate (at 1.5, 3.0 and 4.5 m away from the plate; Fig. 2). A control experiment (without wind plate) had 7 wind cups installed at the similar positions. Wind velocities were recorded every two seconds when the wind velocity was stable, and the whole experiment lasted for 15 min for each measurement.
Fig. 2 Locations of wind velocity measurements along the axis of wind plate (Figs. 2a and c) and around the wind plate (Figs. 2b and d). Figure 2b is a side view of the sand dune. Figure 4d is a front view of the sand dune.
2.2.3 Wind velocity distribution around wind guide plate (Experiment III)
Experiment III is set up on Dune B. In addition to the wind velocity measurements along the plate axis, more sensors were installed around the plate to measure the horizontal wind velocity distributions. In the experimental area, one wind cup was set at 3.0 m in front of the plate, 5 wind cups were set under the plate, and 14 wind cups were set around the plate (Fig. 2). In the control area, 6 wind cups were set along a line.
Wind velocities were analyzed by the Surfer 11.0 with the best linear unbiased estimate according to the Point Kringing and Block Kringing (Yao, 2013). The software could be used to create a surface through interpolation and to simulate the wind velocity distributions on the surface.
2.2.4 Amount of sand transferred (Experiment IV)
Experiment IV was carried out on Dune C and Dune D from November 2015 to March 2016. C and D were two adjacent sand dunes. Both dunes were 8 m high with the windward slope of 30° and the windward length of 16 m. Three wind guide plates were set at 2/3 upper part along the contour line on the north-facing slope on D. The plate angle was set at 45° to the north leaving the outlet height at 10 cm. The wind deflector is set on the west side of the windward slope of C to reduce the wind deflection resulted from different dunes, the east windward slope of C was set as a control slope to research the change of the terrain behind the wind guide plates. There was no plate on the control dune. At the start and end of the experiment, the morphologies of C and D were scanned with RTK GPS. The horizontal resolution was ± 2.5 mm and the vertical resolution was ± 5.0 mm. The data measured by the RTK GPS were processed by ArcGIS 10.2 to calculate the shape, height and volume of C and D and to then assess the leveling effect of wind guide plate.
2.3 Other data sources
The meteorological data were obtained from the China Meteorological Data Service Center (CMDC; http://data.cma.cn/).
3 Results and discussion
3.1 Effects of wind guide plate on wind velocity
Generally, sands can only be moved when the wind velocity is higher than the threshold velocity for sand movement (Li, 2014). Previous studies showed that sands start to move when the wind velocity reached 4.1 m/s at the height of 200 cm in Ulan Buh Desert (He et al., 2011; Liu et al., 2014). Our results show that the threshold velocity for sand movement was 3.32 m/s at the middle of dune slope and 3.19 m/s at the dune top at the 10 cm above the sand surface. In this study, we set the wind velocity of 3.32 m/s as the threshold velocity for sand movement.
Jilantai Observation Station (a nearby station) is located at southwestern edge of Ulan Buh Desert. According to the meteorological data from CMDC, the wind velocity was mostly below the threshold velocity for sand movement. The wind velocity higher than 4 m/s accounted for 22.61%, the wind velocity between 3 and 4 m/s for 23.92%, and the wind velocity between 2 and 3 m/s for 20.03%. It means that most of the winds were below the threshold velocity for sand movement and therefore the wind velocity needs to be accelerated to level the sand dunes.
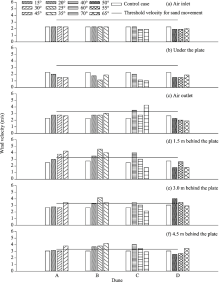
According to the experiment II, the wind velocities under the wind guide plate were reduced and formed weak wind zones behind the plate at all angles (Fig. 3). However, the wind velocities were significantly increased at the outlet for the angles at 15° , 20° , 25° , 30° , 35° , 40° , 45° , 60° and 70° , with the wind velocities increased most at the angles of 40° and 70° . A previous study showed that a current would be separated and disturbed on windward slope of a sand dune due to a squeezing effect. However, the squeezing effect was small for a wind guide plate with angles greater than 50° . As a result, separation and disturbance effects on a current was not significant (Du et al., 2012). Meanwhile, the buffer path with angles less than 50° was relatively long. The plate at the angle of 70° also improved the wind speed at the outlet of the plate.
The leveling (erosion) area of the wind guide plate was the area where the wind velocity reached or higher than the threshold velocity for sand movement. In this study, we found that the leveled area was located at 1.5, 3.0 and 4.5 m behind the plate. But the wind velocities at the leveled area were also affected by the plate angle (Fig. 3).
At 1.5 m behind the plate, the wind velocities for angles less than 50° were higher than that in the control case. It had an obvious acceleration when the wind passed through the plate outlet due to an accumulation of wind energy there. The wind accelerating efficiency of the angles can be ranked in a decreasing order: 25° (37.65%)> 45° (28.92%)> 30° (14.76%)> 20° (6.33%).
At 3.0 m behind the plate, the wind accelerating effect appeared to be reduced compared to that at 1.5 m behind the plate, which might be due to a narrow tube effect (Chen, 2002). The plate with 25° angle had optimum effect of wind acceleration with the wind velocity being 26.20% higher than the threshold velocity. For the angles of 35° , 40° , 45° and 65° , the wind velocities were higher than the threshold velocity for sand movement.
At 4.5 m behind the plate, the wind velocities resumed their upward direction at all the angles except for 50° and 55° , in comparison with wind velocities at 3.0 m behind the plate. This indicated that the wind, separated by the plates, reassembled with the plate-accelerated winds at a certain distance behind the plate. The reassembled wind was enhanced with an uplifting effect of the windward slope of the sand dune, which formed a small but strong wind zone at the top of the dune. The wind accelerating efficiency of the plates can be ranked in a decreasing order: 35° (26.20%)> 40° (21.39%)> 45° (15.06%)> 25° (14.76%).
In general, the wind velocity could be higher than the threshold velocity for sand movement behind the plate when the angles were at 20° , 25° , 35° and 40° . The optimum wind acceleration occurred at the angle of 25° . The wind acceleration effect of 20° was less than those of 25° , 35° and 40° . Although the wind velocities could also be accelerated to a limited distance behind the plate when the angles were at 60° and 65° , the effectiveness was smaller than those at other angles.
Fig. 3 Wind velocities at different locations around the wind guide plate with various angles
3.2 Characteristics of wind velocity distribution around the wind plates
Wind velocity flow field is the distribution of wind velocities in a certain space. Until now, the wind velocity distribution has been measured for different purposes, such as wind break and wind erosion control (Liang et al., 2010; Wu et al., 2015; Yuan et al., 2016).
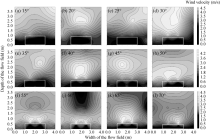
According to the experiment III, the wind velocity distribution behind the wind guide plate is shown in Figure 4. There was an obvious weak wind area under the plate regardless of the angles. For the angles of 25° and 35° , an obvious wind-strengthening zone was formed at 1.5 m behind the plate. Then, the wind velocity decreased with the increase of the distance away from the plate. At 1.0 m behind the plate, the wind velocity completely recovered. It was noted that the wind-strengthening zones appeared 2.0 m behind the plate with the angles at 40° and 45° . The plate with the angle of 70° significantly reduced wind speed due to a large angle between plate and sand surface. The wind velocity recovered slightly at 3.0 m behind the plate, but had no significant accelerating effect on wind velocity when the angle was at the angle of 70° .
Fig. 4 The wind velocity distributions around a wind guide plate. The white rectangle indicates the location of the wind guide plate. The number at the top left corner in each figure is the angle.
3.3 Amount of sand transferred
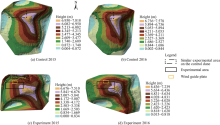
In Experiment IV, a 5-month field experiment was conducted to measure the effects of a wind guide plate on dune height reduction and leveling over the windy season. Figure 5 showed the amount of sand transferred for the 5-month period. With the erosion by northerly and northwesterly winds for 5 months, the wing angle and leeward slope of the sand dune were extended southward, and the entire dune also showed a southward moving trend. With the installation of a wind guide plate, an obvious wind erosion was observed. However, similar phenomenon was not observed at the same positions for the control dune. Because the wind guide plate was not set along the axis of the windward slope of the sand dune, the plate did not have a direct impact on the top of the sand dune. Therefore, after 5-month wind erosion, the dune height only decreased by 0.12 m, while the control dune height decreased by 0.22 m. However, in terms of the size of sand dune, the total volume of sand dune was reduced from 6129 to 5389 m3, resulting in a total erosion rate of 12% for the dune with the wind guide plate while the total erosion rate for the control dune was only 5.88%, with the total volume decreased from 9496 to 8938 m3. The volume reduction rate of experimental dune (C) was 6.12% higher than that of the control dune (D). Thus, the wind guide plate was proved to be efficient in dune leveling. It was reported that geomorphology plays an important role in prevention of sand movement. Previous studies found that the slope toe and center part of a sand dune mainly exhibited surface deposition, whereas the crest of a dune primarily experienced surface erosion (Wang and Lei, 1998; Cheng et al., 2015).
Fig. 5 Sand transfer characteristics under the effects of wind guide plates during a 5-month period from November 2015 to March 2016
4 Conclusions
This study focused on the effects of a wind guide plate on wind velocities and the sand dune leveling in Ulan Buh Desert of China. On the basis of our results and findings, following conclusions can be drawn. First, low wind velocity was a notable characteristic of Ulan Buh Desert, the annual average wind velocity was much lower than the threshold velocity for sand movement. And the threshold velocity for sand movement at the height of 10 cm of dune top was 3.32 m/s. Second, the wind velocities at the outlet of the wind guide plate were increased at all angles except 50° , 55° and 65° . The plate with angles of 40° and 70° accelerated the wind velocities to a level higher than the threshold velocity for sand movement. Third, the wind guide plate set at an angle smaller than 50° increased wind velocity significantly. The plate with angles of 20° , 25° , 35° and 40° increased the wind velocities to a level higher than the threshold velocity for sand movement behind the plate. Significant accelerations of wind velocities were observed at 1.5 and 2.0 m behind the wind guide plate with the angle of 25° . Fourth, an obvious wind velocity acceleration zone was formed behind the plate at the angles of 25° , 35° , 40° and 45° with the plate at 45° being the most obvious one. Fifth, the erosion rate of the sand dune with a wind guide plate was 12.0%, while the rate was only 5.9% without the plate. Therefore, the total amount of sand erosion of the experimental dune increased by 6.1% under the effects of the wind guide plate. A wind guide plate could effectively level sand dunes. Further field observations and more detailed studies are required to reveal the effects of a wind guide plate on sand movement over the entire surface of a sand dune.
Acknowledgements
This study was supported by the National Key Technology Research and Development Program of the Ministry of Science and Technology of China (2015BAC06B00) and the Natural Science Foundation of the Inner Mongolia Autonomous Region of China (2014ZD03). We are grateful to Dr. CHAI Minwei from Peking University for the help in data analysis and language improving. Special thanks to Elsevier Language Editing for their efforts in improving the language of this paper.
The authors have declared that no competing interests exist.
Asi IM, Al-Abdul Wahhab HI, Baghabra Al-Amoudi OS, et al. 2002. Stabilization of dune sand using foamed asphalt. Geotechnical Testing Journal, 25(2): 168-176. [Cited Within:1]
[3]
Bagnold RA. 1941. The Physics of Blown Sand and Desert Dunes. London: Methuen, 10-37. [Cited Within:1]
[4]
Bao YF. 2015. Windbreak effects of shelterbelt in oases based on wind velocity flow field. PhD Dissertation. Beijing: Beijing Forestry University, 24-25. (in Chinese)[Cited Within:1]
Chen QX. 2002. Venturi effect on increasing of wind velocity. Shanxi Hydrotechnics, 144: 62-64. (in Chinese)[Cited Within:1]
[7]
ChengH, He JJ, Xu XR, et al. 2015. Blown sand motion within the sand -control system in the southern section of the Taklimakan Desert Highway. Journal of Arid Land , 7(5): 599-611. [Cited Within:1]
[8]
Craddock RA, ToothS, Zimbelman JR, et al. 2015. Temporal observations of a linear sand dune in the Simpson Desert, central Australia: Testing models for dune formation on planetary surfaces. Journal of Geophysical Research: Planets, 120(10): 1736-1750. [Cited Within:1]
[9]
D’OdoricoP, BhattachanA, Davis KF, et al. 2013. Global desertification: drivers and feedbacks. Advances in Water Resources, 51: 326-344. [Cited Within:1]
[10]
Dong ZB. 2005. Research achievements in Aeolian physics in china for the last five decades (I). Journal of Desert Research, 25(3): 293-305. (in Chinese)[Cited Within:1]
[11]
Du HQ, Han ZW, WangT, et al. 2012. Variation of wind profile and sand flow structure above Barchan Dune. Journal of Desert Research, 32(1): 9-16. (in Chinese)[Cited Within:1]
[12]
Fryberger SG, DeanG. 1979. Dune forms and wind regime. In: McKee E D. A Study of Global Sand Seas. Hawaii: United States Geological Survey, 137-169. [Cited Within:1]
[13]
Hao YG. 2007. Study on ecological effects of oasis-making process in the Northeast part of Ulan Buh Desert. PhD Dissertation. Beijing: Beijing Forestry University. (in Chinese)[Cited Within:1]
[14]
He JL, Zhang SH, CuiW, et al. 2011. Monitoring and research on Aeolian sand flowed into Yellow River from Ulan Buh Desert in Inner Mongolia. China Water Resources, (10): 46-48. (in Chinese)[Cited Within:1]
[15]
Hesse PP, Simpson RL. 2006. Variable vegetation cover and episodic sand movement on longitudinal desert sand dunes. Geomorphology, 81(3-4): 276-291. [Cited Within:1]
[16]
HuangN, Zheng XJ. 2001. A laboratory test of the electrification phenomenon in wind-blown sand flux. Chinese Science Bulletin, 46(5): 417-420. [Cited Within:1]
[17]
Li YL, Cui JY, Zhang TH, et al. 2009. Effectiveness of sand -fixing measures on desert land restoration in Kerqin Sand y Land , northern China. Ecological Engineering, 35(1): 118-127. [Cited Within:1]
[18]
LiZ. 2014. The research on the criteria of incipient motion of sand particles in windblown sand . MSc Thesis. Lanzhou: Lanzhou University, 7-9. (in Chinese)[Cited Within:1]
[19]
Liang HR, Wang JY, Dong HL, et al. 2010. Wind velocity field and windbreak effects in two types of low density and belt-scheme sand -break forests. Acta Ecologica Sinica, 30(3): 568-578. (in Chinese)[Cited Within:1]
[20]
LiuF, Hao YG, Xin ZM, et al. 2014. The surface Aeolian-sand flow structure in the northeastern margin of the Ulanbuh Desert. Journal of Desert Research, 34(5): 1200-1207. (in Chinese)[Cited Within:1]
Qu JJ, Zhang KC, Zhang WM, et al. 2012. Characteristics of sand -blown flow over simulated Gobi surfaces. Journal of Desert Research, 32(2): 285-290. (in Chinese)[Cited Within:1]
[23]
Reynolds JF, Smith D MS, Lambin EF, et al. 2007. Global desertification: building a science for dryland development. Science, 316(5826): 847-851. [Cited Within:1]
[24]
Tan LH, Zhang WM, Qu JJ, et al. 2013. Aeolian sand transport over gobi with different gravel coverages under limited sand supply: A mobile wind tunnel investigation. Aeolian Research, 11: 67-74. [Cited Within:1]
[25]
WangF, Pan XB, Wang DF, et al. 2013. Combating desertification in China: past, present and future. Land Use Policy, 31: 311-313. [Cited Within:2]
[26]
Wang WB, Dang XH, Zhang JS, et al. 2013. The wind-breaking efficiency of low vertical sand barriers with different materials in northern edge of the Hobq Desert. Journal of Desert Research, 33(1): 65-71. (in Chinese)[Cited Within:1]
[27]
Wang XP, Li XR, Xiao HL, et al. 2006. Evolutionary characteristics of the artificially revegetated shrub ecosystem in the Tengger Desert, northern China. Ecological Research, 21(3): 415-424. [Cited Within:1]
[28]
Wang XQ, Lei JQ. 1998. Sand deposit and erosion characteristics of semi-fixed linear dunes in Gurbantunggut Desert. Arid Zone Research, 15(1): 35-39. (in Chinese)[Cited Within:1]
Wilson GR. 1994. Modeling wind erosion: detachment and maximum transport rate. PhD Dissertation. Lubbock: Texas Tech University. [Cited Within:1]
[31]
Wu JY. 2009. Study on effects and mechanism of the integrated controlling sand hazard to highway in Otindag sand y land . PhD Dissertation. Hohhot: Inner Mongolia Agricultural University. (in Chinese)[Cited Within:1]
[32]
Wu XX, Zou XY, ZhouN, et al. 2015. Deceleration efficiencies of shrub windbreaks in a wind tunnel. Aeolian Research, 16: 11-23. [Cited Within:1]
[33]
Yao LQ. 2013. Airflow velocity field characteristics of different roadbed section in Gobi segment of Lin-Ce railway. MSc Thesis. Hohhot: Inner Mongolia Agricultural University. (in Chinese)[Cited Within:1]
[34]
Ying CL. 2007. Research on the countermeasures of the blowing snow hazards on highway. PhD Dissertation. Changchun: Jilin University. (in Chinese)[Cited Within:1]
[35]
YuanF, Zhang ZS, Bu CF, et al. 2016. Wind speed flow field and wind erosion control measures at photovoltaic power plant project area in Mu us sand y land . Journal of Desert Research, 36(2): 287-294. (in Chinese)[Cited Within:1]
[36]
Zang YX, GongW, XieH, et al. 2015. Chemical sand stabilization: a review of material, mechanism, and problems. Environmental Technology Reviews, 4(1): 119-132. [Cited Within:2]
[37]
Zhang TH, Zhao HL, Li SG, et al. 2004. A comparison of different measures for stabilizing moving sand dunes in the Horqin Sand y Land of Inner Mongolia, China. Journal of Arid Environments, 58(2): 203-214. [Cited Within:1]
[38]
Zhang ZC, Dong ZB, Zhao AG. 2010. Effect of different time intervals in assessing sand drift potential. Arid Land Geography, 33(2): 177-182. (in Chinese)[Cited Within:1]
1
2005
0.0
0.0
... Alghamdi and Al-Kahtani, 2005), biological (Zhang et al ...
1
2002
0.0
0.0
... Thus, worldwide efforts have been made to prevent and control sandy desertification by mechanical (Asi et al ...
1
1941
0.0
0.0
... Previous studies showed that 90% of windblown sands were transferred within 30 cm above the sand surface, of which approximate 90% was concentrated within the height of 10 cm (Bagnold, 1941 ...
1
2015
0.0
0.0
... At the top of the sand dune, two wind velocity meters (10-channel HOBO RX3000, Onset Computer Corporation, USA) were installed to measure the wind speed and direction at the heights of 10 and 200 cm (Bao, 2015), respectively ...
1
2015
0.0
0.0
... Bruno and Fransos, 2015) ...
1
2002
0.0
0.0
... 5 m behind the plate, which might be due to a narrow tube effect (Chen, 2002) ...
1
2015
0.0
0.0
... Cheng et al ...
1
2015
0.0
0.0
... Other factors affecting the formation and development of sand dunes include sand abundance and availability, ground surface characteristics, topography of the sand source and deposition areas, and the size of sand dunes (Craddock et al ...
1
2013
0.0
0.0
... D#cod#x02019 ...
1
2005
0.0
0.0
... Some studies showed that the application of engineering and biological measures could effectively level the sand dunes to a lower height (Dong, 2005 ...
1
2012
0.0
0.0
... As a result, separation and disturbance effects on a current was not significant (Du et al ...
1
1979
0.0
0.0
... The different sand dune patterns, such as crescent, transverse, linear, feathery, and star dunes, are shaped by different wind speeds and wind directions (Fryberger and Dean, 1979 ...
1
2007
0.0
0.0
... 9 d/a (Hao, 2007) ...
1
2011
0.0
0.0
... 1 m/s at the height of 200 cm in Ulan Buh Desert (He et al ...
1
2006
0.0
0.0
... Hesse and Simpson, 2006 ...
1
2001
0.0
0.0
... (Huang and Zheng, 2001 ...
1
2009
0.0
0.0
... Li et al ...
1
2014
0.0
0.0
... 1 Effects of wind guide plate on wind velocityGenerally, sands can only be moved when the wind velocity is higher than the threshold velocity for sand movement (Li, 2014) ...
1
2010
0.0
0.0
... Until now, the wind velocity distribution has been measured for different purposes, such as wind break and wind erosion control (Liang et al ...
1
2014
0.0
0.0
... Liu et al ...
1
1996
0.0
0.0
... Livingstone and Warren, 1996 ...
1
2012
0.0
0.0
... Qu et al ...
1
2007
0.0
0.0
... 106 people around the world (Reynolds et al ...
1
2013
0.0
0.0
... Tan et al ...
2
2013
0.0
0.0
... Wang et al ...
... In this study, the threshold velocity for sand movement at the height of 10 cm was calculated based on the threshold velocity for sand movement at the height of 200 cm (Wang et al ...
1
2013
0.0
0.0
1
2006
0.0
0.0
... 1 IntroductionDesertification resulted from climatic variability and human activities is a major environmental issue in arid areas, which induced the degradation of ecosystem services and threatened human living conditions (Wang et al ...
1
1998
0.0
0.0
... Previous studies found that the slope toe and center part of a sand dune mainly exhibited surface deposition, whereas the crest of a dune primarily experienced surface erosion (Wang and Lei, 1998 ...
1
1983
0.0
0.0
... Wasson and Hyde, 1983 ...
1
1994
0.0
0.0
... Wilson, 1994 ...
1
2009
0.0
0.0
... Wind guide plates have been widely used by industrial and mining enterprises to prevent wind and snow damages to roads (Wu, 2009) because the plates can effectively change the wind direction and increase the wind velocity ...
1
2015
0.0
0.0
... Wu et al ...
1
2013
0.0
0.0
... 0 with the best linear unbiased estimate according to the Point Kringing and Block Kringing (Yao, 2013) ...
1
2007
0.0
0.0
... Ying, 2007) ...
1
2016
0.0
0.0
... Yuan et al ...
2
2015
0.0
0.0
... , 2009), and chemical measures (Zang et al ...
... Zang et al ...
1
2004
0.0
0.0
... Alghamdi and Al-Kahtani, 2005), biological (Zhang et al ...
1
2010
0.0
0.0
... Zhang et al ...
Effects of wind guide plates on wind velocity acceleration and dune leveling: a case study in Ulan Buh Desert, China


 , MENG Zhongju, DANG Xiaohong, JIA Xu, DING Yanlong, LI Peng]